plot_statistics(df,pca_vars,'mean',color='b')
# all means are zero
The datasets contains transactions made by credit cards in September 2013 by european cardholders.
This dataset presents transactions that occurred in two days, where we have 492 frauds out of 284,807 transactions.
The dataset is highly unbalanced, the positive class (frauds) account for 0.172% of all transactions.
It contains only numerical input variables which are the result of a PCA transformation.
Unfortunately, due to confidentiality issues, we cannot provide the original features and more background information about the data.
Features V1, V2, ... V28 are the principal components obtained with PCA, the only features which have not been transformed with PCA are 'Time' and 'Amount'.
Feature 'Time' contains the seconds elapsed between each transaction and the first transaction in the dataset. The feature 'Amount' is the transaction Amount, this feature can be used for example-dependant cost-senstive learning.
Feature 'Class' is the response variable and it takes value 1 in case of fraud and 0 otherwise.
import numpy as np
import pandas as pd
import seaborn as sns
sns.set(color_codes=True)

import matplotlib
import matplotlib.pyplot as plt
%matplotlib inline

import os
import time

# random state
SEED = 0
RNG = np.random.RandomState(SEED)

# Jupyter notebook settings for pandas
pd.set_option('display.max_columns', 200)
pd.set_option('display.max_rows', 100) # None for all the rows
pd.set_option('display.max_colwidth', 50)

print([(x.__name__,x.__version__) for x in [np, pd,sns,matplotlib]])
[('numpy', '1.16.4'), ('pandas', '0.25.0'), ('seaborn', '0.9.0'), ('matplotlib', '3.1.1')]
import scipy
from scipy import stats
import IPython
from IPython.display import display
from sklearn.preprocessing import MinMaxScaler, StandardScaler, RobustScaler
def show_method_attributes(method, ncols=7):
    """ Show all the attributes of a given method.
    Example:
    ========
    show_method_attributes(list)
     """
    x = [i for i in dir(method) if i[0].islower()]
    x = [i for i in x if i not in 'os np pd sys time psycopg2'.split()]

    return pd.DataFrame(np.array_split(x,ncols)).T.fillna('')
def json_dump_tofile(myjson,ofile,sort_keys=False):
    """Write json dictionary to a datafile.

    Usage:
    myjson = {'num': 5, my_list = [1,2,'apple']}
    json_dump_tofile(myjson, ofile)

    """
    import io
    import json

    with io.open(ofile, 'w', encoding='utf8') as fo:
        json_str = json.dumps(myjson,
                          indent=4,
                          sort_keys=sort_keys,
                          separators=(',', ': '),
                          ensure_ascii=False)
        fo.write(str(json_str))
df = pd.read_csv('../data/raw/creditcard.csv.zip',compression='zip')
print(df.shape)
df.head()
(284807, 31)
| Time | V1 | V2 | V3 | V4 | V5 | V6 | V7 | V8 | V9 | V10 | V11 | V12 | V13 | V14 | V15 | V16 | V17 | V18 | V19 | V20 | V21 | V22 | V23 | V24 | V25 | V26 | V27 | V28 | Amount | Class | |
|---|---|---|---|---|---|---|---|---|---|---|---|---|---|---|---|---|---|---|---|---|---|---|---|---|---|---|---|---|---|---|---|
| 0 | 0.0 | -1.359807 | -0.072781 | 2.536347 | 1.378155 | -0.338321 | 0.462388 | 0.239599 | 0.098698 | 0.363787 | 0.090794 | -0.551600 | -0.617801 | -0.991390 | -0.311169 | 1.468177 | -0.470401 | 0.207971 | 0.025791 | 0.403993 | 0.251412 | -0.018307 | 0.277838 | -0.110474 | 0.066928 | 0.128539 | -0.189115 | 0.133558 | -0.021053 | 149.62 | 0 |
| 1 | 0.0 | 1.191857 | 0.266151 | 0.166480 | 0.448154 | 0.060018 | -0.082361 | -0.078803 | 0.085102 | -0.255425 | -0.166974 | 1.612727 | 1.065235 | 0.489095 | -0.143772 | 0.635558 | 0.463917 | -0.114805 | -0.183361 | -0.145783 | -0.069083 | -0.225775 | -0.638672 | 0.101288 | -0.339846 | 0.167170 | 0.125895 | -0.008983 | 0.014724 | 2.69 | 0 |
| 2 | 1.0 | -1.358354 | -1.340163 | 1.773209 | 0.379780 | -0.503198 | 1.800499 | 0.791461 | 0.247676 | -1.514654 | 0.207643 | 0.624501 | 0.066084 | 0.717293 | -0.165946 | 2.345865 | -2.890083 | 1.109969 | -0.121359 | -2.261857 | 0.524980 | 0.247998 | 0.771679 | 0.909412 | -0.689281 | -0.327642 | -0.139097 | -0.055353 | -0.059752 | 378.66 | 0 |
| 3 | 1.0 | -0.966272 | -0.185226 | 1.792993 | -0.863291 | -0.010309 | 1.247203 | 0.237609 | 0.377436 | -1.387024 | -0.054952 | -0.226487 | 0.178228 | 0.507757 | -0.287924 | -0.631418 | -1.059647 | -0.684093 | 1.965775 | -1.232622 | -0.208038 | -0.108300 | 0.005274 | -0.190321 | -1.175575 | 0.647376 | -0.221929 | 0.062723 | 0.061458 | 123.50 | 0 |
| 4 | 2.0 | -1.158233 | 0.877737 | 1.548718 | 0.403034 | -0.407193 | 0.095921 | 0.592941 | -0.270533 | 0.817739 | 0.753074 | -0.822843 | 0.538196 | 1.345852 | -1.119670 | 0.175121 | -0.451449 | -0.237033 | -0.038195 | 0.803487 | 0.408542 | -0.009431 | 0.798278 | -0.137458 | 0.141267 | -0.206010 | 0.502292 | 0.219422 | 0.215153 | 69.99 | 0 |
df.filter(regex='V').columns
Index(['V1', 'V2', 'V3', 'V4', 'V5', 'V6', 'V7', 'V8', 'V9', 'V10', 'V11',
       'V12', 'V13', 'V14', 'V15', 'V16', 'V17', 'V18', 'V19', 'V20', 'V21',
       'V22', 'V23', 'V24', 'V25', 'V26', 'V27', 'V28'],
      dtype='object')
pca_vars = ['V%i' % k for k in range(1,29)]
df[pca_vars].describe()
| V1 | V2 | V3 | V4 | V5 | V6 | V7 | V8 | V9 | V10 | V11 | V12 | V13 | V14 | V15 | V16 | V17 | V18 | V19 | V20 | V21 | V22 | V23 | V24 | V25 | V26 | V27 | V28 | |
|---|---|---|---|---|---|---|---|---|---|---|---|---|---|---|---|---|---|---|---|---|---|---|---|---|---|---|---|---|
| count | 2.848070e+05 | 2.848070e+05 | 2.848070e+05 | 2.848070e+05 | 2.848070e+05 | 2.848070e+05 | 2.848070e+05 | 2.848070e+05 | 2.848070e+05 | 2.848070e+05 | 2.848070e+05 | 2.848070e+05 | 2.848070e+05 | 2.848070e+05 | 2.848070e+05 | 2.848070e+05 | 2.848070e+05 | 2.848070e+05 | 2.848070e+05 | 2.848070e+05 | 2.848070e+05 | 2.848070e+05 | 2.848070e+05 | 2.848070e+05 | 2.848070e+05 | 2.848070e+05 | 2.848070e+05 | 2.848070e+05 |
| mean | 1.165980e-15 | 3.416908e-16 | -1.373150e-15 | 2.086869e-15 | 9.604066e-16 | 1.490107e-15 | -5.556467e-16 | 1.177556e-16 | -2.406455e-15 | 2.239751e-15 | 1.673327e-15 | -1.254995e-15 | 8.176030e-16 | 1.206296e-15 | 4.913003e-15 | 1.437666e-15 | -3.800113e-16 | 9.572133e-16 | 1.039817e-15 | 6.406703e-16 | 1.656562e-16 | -3.444850e-16 | 2.578648e-16 | 4.471968e-15 | 5.340915e-16 | 1.687098e-15 | -3.666453e-16 | -1.220404e-16 |
| std | 1.958696e+00 | 1.651309e+00 | 1.516255e+00 | 1.415869e+00 | 1.380247e+00 | 1.332271e+00 | 1.237094e+00 | 1.194353e+00 | 1.098632e+00 | 1.088850e+00 | 1.020713e+00 | 9.992014e-01 | 9.952742e-01 | 9.585956e-01 | 9.153160e-01 | 8.762529e-01 | 8.493371e-01 | 8.381762e-01 | 8.140405e-01 | 7.709250e-01 | 7.345240e-01 | 7.257016e-01 | 6.244603e-01 | 6.056471e-01 | 5.212781e-01 | 4.822270e-01 | 4.036325e-01 | 3.300833e-01 |
| min | -5.640751e+01 | -7.271573e+01 | -4.832559e+01 | -5.683171e+00 | -1.137433e+02 | -2.616051e+01 | -4.355724e+01 | -7.321672e+01 | -1.343407e+01 | -2.458826e+01 | -4.797473e+00 | -1.868371e+01 | -5.791881e+00 | -1.921433e+01 | -4.498945e+00 | -1.412985e+01 | -2.516280e+01 | -9.498746e+00 | -7.213527e+00 | -5.449772e+01 | -3.483038e+01 | -1.093314e+01 | -4.480774e+01 | -2.836627e+00 | -1.029540e+01 | -2.604551e+00 | -2.256568e+01 | -1.543008e+01 |
| 25% | -9.203734e-01 | -5.985499e-01 | -8.903648e-01 | -8.486401e-01 | -6.915971e-01 | -7.682956e-01 | -5.540759e-01 | -2.086297e-01 | -6.430976e-01 | -5.354257e-01 | -7.624942e-01 | -4.055715e-01 | -6.485393e-01 | -4.255740e-01 | -5.828843e-01 | -4.680368e-01 | -4.837483e-01 | -4.988498e-01 | -4.562989e-01 | -2.117214e-01 | -2.283949e-01 | -5.423504e-01 | -1.618463e-01 | -3.545861e-01 | -3.171451e-01 | -3.269839e-01 | -7.083953e-02 | -5.295979e-02 |
| 50% | 1.810880e-02 | 6.548556e-02 | 1.798463e-01 | -1.984653e-02 | -5.433583e-02 | -2.741871e-01 | 4.010308e-02 | 2.235804e-02 | -5.142873e-02 | -9.291738e-02 | -3.275735e-02 | 1.400326e-01 | -1.356806e-02 | 5.060132e-02 | 4.807155e-02 | 6.641332e-02 | -6.567575e-02 | -3.636312e-03 | 3.734823e-03 | -6.248109e-02 | -2.945017e-02 | 6.781943e-03 | -1.119293e-02 | 4.097606e-02 | 1.659350e-02 | -5.213911e-02 | 1.342146e-03 | 1.124383e-02 |
| 75% | 1.315642e+00 | 8.037239e-01 | 1.027196e+00 | 7.433413e-01 | 6.119264e-01 | 3.985649e-01 | 5.704361e-01 | 3.273459e-01 | 5.971390e-01 | 4.539234e-01 | 7.395934e-01 | 6.182380e-01 | 6.625050e-01 | 4.931498e-01 | 6.488208e-01 | 5.232963e-01 | 3.996750e-01 | 5.008067e-01 | 4.589494e-01 | 1.330408e-01 | 1.863772e-01 | 5.285536e-01 | 1.476421e-01 | 4.395266e-01 | 3.507156e-01 | 2.409522e-01 | 9.104512e-02 | 7.827995e-02 |
| max | 2.454930e+00 | 2.205773e+01 | 9.382558e+00 | 1.687534e+01 | 3.480167e+01 | 7.330163e+01 | 1.205895e+02 | 2.000721e+01 | 1.559499e+01 | 2.374514e+01 | 1.201891e+01 | 7.848392e+00 | 7.126883e+00 | 1.052677e+01 | 8.877742e+00 | 1.731511e+01 | 9.253526e+00 | 5.041069e+00 | 5.591971e+00 | 3.942090e+01 | 2.720284e+01 | 1.050309e+01 | 2.252841e+01 | 4.584549e+00 | 7.519589e+00 | 3.517346e+00 | 3.161220e+01 | 3.384781e+01 |
def plot_statistics(df,features,statistic,color='b'):
    plt.figure(figsize=(12,4), dpi=80)
    sns.barplot(x=features, y= df[pca_vars].agg(statistic),color=color)
    plt.xlabel('Features')
    plt.ylabel(statistic.title())
    plt.title(statistic.title()+ ' for all features')
    plt.savefig(f'../reports/statistics/{statistic}.png',dpi=300)
    plt.show()
    plt.close()
plot_statistics(df,pca_vars,'mean',color='b')
# all means are zero
plot_statistics(df,pca_vars,'std',color='tomato')

# NOTE that we have PCA selected variables and variables have decreasing variance.
# all std are less than 2.0

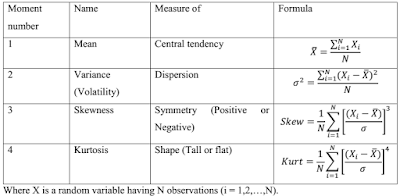
plot_statistics(df,pca_vars,'skew',color='seagreen')

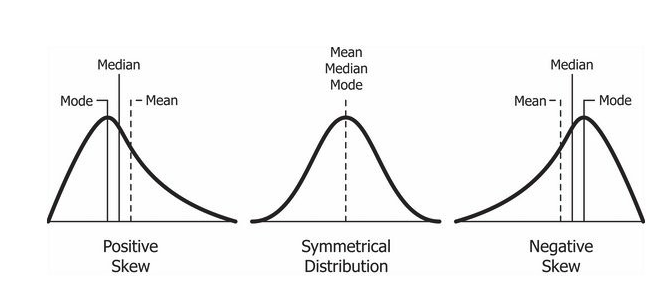
# top point is always mode
# also, we have mean median mode (the order does not change, but <> changes.)
# for +ve skew, mean > median > mode
# for -ve skew, mean < median < mode
# some features are skewed eg. V8, V23, V28
df['V28'].skew()
11.192091192212809
plt.figure(figsize=(12,4), dpi=80)
sns.distplot(df['V28'], bins=300, kde=False)
plt.ylabel('Count')
plt.title(' distribution plot of feature: V28')

# almost all of data is centered around 0.
Text(0.5, 1.0, ' distribution plot of feature: V28')
plt.figure(figsize=(12,4), dpi=80)
sns.distplot(df['V28'], bins=3000, kde=False)
plt.ylabel('Count')
plt.title(' distribution plot of feature: V28 with selected x limit')
plt.xlim(-2,2)

# almost all of data is centered around 0.
(-2, 2)
plt.figure(figsize=(12,4), dpi=80)
sns.boxplot(df['V28'])
plt.title('Box plot of feature: V28')
plt.savefig('../reports/statistics/v28_boxplot.png',dpi=300)

# there are so many outliers
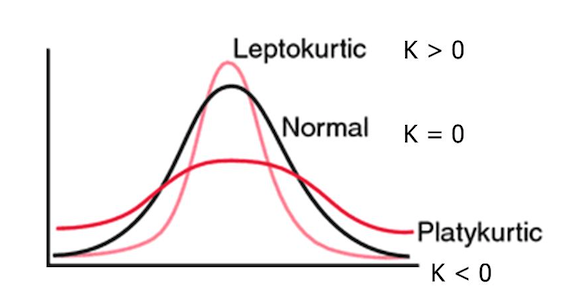
# boxplot is hard to read, we can plot kurtosis plot.


plot_statistics(df,pca_vars,'kurtosis',color='darkorange')
df['V28'].kurtosis()
933.3975020960183
# pca variables are heavily tailed, we can use more robust descriptive
# statistic such as median.
plot_statistics(df,pca_vars,'median',color='b')

# medians are roughly 0
plt.figure(figsize=(12,4), dpi=80)
sns.barplot(x=pca_vars, y=df[pca_vars].quantile(0.75)
            - df[pca_vars].quantile(0.25), color='darkred')
plt.xlabel('Column')
plt.ylabel('IQR')
plt.title('V1-V28 IQRs')
plt.savefig('../reports/statistics/iqr.png',dpi=300)
plot_statistics(df,pca_vars,'std',color='darkred')
# IQR and standard deviations look very similar.
# this means not too many points are outliers.
plt.figure(figsize=(12,8))
ax = sns.boxplot(data = df.drop(columns=['Amount', 'Class', 'Time']),
  orient = 'h', palette = 'winter')

ax.set(xlim=(-5,5))
ax.set_facecolor('#fafafa')
ax.set_title('Box plots of features V1 to V28')
ax.set_ylabel('Variables')
plt.savefig('../reports/statistics/boxplot_all_features.png',dpi=300)
from sklearn.feature_selection import mutual_info_classif
%%time
mutual_infos = pd.Series(data=mutual_info_classif(df[pca_vars], df['Class'],
                                                  discrete_features=False,
                                                  random_state=random_state),
                         index=pca_vars)
CPU times: user 1min 20s, sys: 1.33 s, total: 1min 21s
Wall time: 1min 23s
mutual_infos.sort_values(ascending=False).to_frame().T

# most related quantites are v17, v14, v12 and so on.
| V17 | V14 | V12 | V10 | V11 | V16 | V4 | V3 | V18 | V9 | V7 | V2 | V21 | V27 | V5 | V6 | V1 | V8 | V28 | V19 | V20 | V23 | V24 | V26 | V25 | V13 | V22 | V15 | |
|---|---|---|---|---|---|---|---|---|---|---|---|---|---|---|---|---|---|---|---|---|---|---|---|---|---|---|---|---|
| 0 | 0.008258 | 0.008136 | 0.007601 | 0.00753 | 0.006831 | 0.006144 | 0.004976 | 0.004952 | 0.004317 | 0.004277 | 0.003952 | 0.003228 | 0.002452 | 0.002444 | 0.002391 | 0.002388 | 0.002127 | 0.001898 | 0.001871 | 0.001472 | 0.001207 | 0.000762 | 0.000642 | 0.0005 | 0.000498 | 0.000408 | 0.000353 | 0.000315 |