The datasets contains transactions made by credit cards in September 2013 by european cardholders.
This dataset presents transactions that occurred in two days, where we have 492 frauds out of 284,807 transactions.
The dataset is highly unbalanced, the positive class (frauds) account for 0.172% of all transactions.
It contains only numerical input variables which are the result of a PCA transformation.
Unfortunately, due to confidentiality issues, we cannot provide the original features and more background information about the data.
Features V1, V2, ... V28 are the principal components obtained with PCA, the only features which have not been transformed with PCA are 'Time' and 'Amount'.
Feature 'Time' contains the seconds elapsed between each transaction and the first transaction in the dataset. The feature 'Amount' is the transaction Amount, this feature can be used for example-dependant cost-senstive learning.
Feature 'Class' is the response variable and it takes value 1 in case of fraud and 0 otherwise.
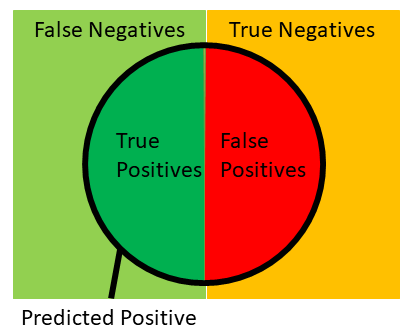
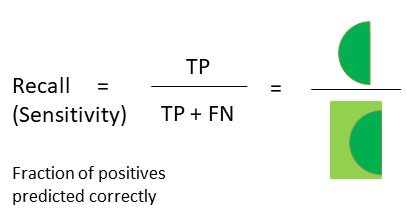
Remember that Recall = TP / (TP + FN)
. In case of fraud detection,
classifying a fraud as
non-fraud (FN) is more risky so we use the metric recall
to compare the
performances of the models. Higher the recall, better is the model.
The dataset is highly imbalanced. It has 284k non-frauds and 1k frauds. This means out of 1000 transatiosn, 998 are normal and 2 are fraud cases.
Also, we should note that the data is just of two days, we implicitly assume that these two days are represent of the whole trend and reflects the property of the population properly.
The could have been more or less fraudulent transactions in those particular days, but we would not take that into consideration and we generalizes the result. Or, we can say that based on the data from these two days we reached following conclusion and the result is appropriate for the population where the data distribution is similar to that of these two days.
We are more interestd in finding the Fraud cases. i.e. FN (False Negative) cases, predicting fraud as non-fraud is riskier than predicting non-fraud as fraud. So, the suitable metric of model evaluation is RECALL.
In banking, it is always the case that there are a lot of normal transactions, and only few of them are fraudulent. We may train our model with any transformation of the training data, but when testing the model the test set should look like real life, i.e., it has lots of normal cases and very few fraudulent cases.
This means we can train our model using imbalanced or balanced (undersamples or oversampled) but we should test our model on IMBALANCED dataset.
import bhishan
%load_ext autoreload
%autoreload 2
from bhishan.util_model_eval import get_binary_classification_scalar_metrics
from bhishan.util_model_eval import print_confusion_matrix_frauds
from bhishan.util_model_eval import plot_confusion_matrix_plotly
import numpy as np
import pandas as pd
import seaborn as sns
sns.set(color_codes=True)
import matplotlib
import matplotlib.pyplot as plt
%matplotlib inline
import os
import time
# random state
SEED = 0
RNG = np.random.RandomState(SEED)
# Jupyter notebook settings for pandas
pd.set_option('display.max_columns', 200)
pd.set_option('display.max_rows', 100) # None for all the rows
pd.set_option('display.max_colwidth', 50)
print([(x.__name__,x.__version__) for x in [np, pd,sns,matplotlib]])
[('numpy', '1.16.4'), ('pandas', '0.25.0'), ('seaborn', '0.9.0'), ('matplotlib', '3.1.1')]
import scipy
from scipy import stats
# six and pickle
import six
import pickle
import joblib
# scale and split
from sklearn.preprocessing import MinMaxScaler, StandardScaler, RobustScaler
from sklearn.model_selection import train_test_split
from sklearn.model_selection import StratifiedKFold
# classifiers
from sklearn.linear_model import LogisticRegression
from sklearn.svm import SVC
from sklearn.neighbors import KNeighborsClassifier
from sklearn.tree import DecisionTreeClassifier
from sklearn.ensemble import RandomForestClassifier
# grid search
from sklearn.model_selection import GridSearchCV, RandomizedSearchCV
from sklearn.model_selection import StratifiedKFold
# pipeline
from sklearn.pipeline import make_pipeline
# cross validations
#------------------
# cross_val_score(lasso, X, y, cv=5,n_jobs=-1,scoring='r2')
# cross_val_score(clf, X, y, cv=5,n_jobs=-1,scoring='recall')
from sklearn.model_selection import cross_val_score
#------------------
# cross_val_predict may differ from cross_validate and cross_val_score
# cross_val_predict can be used for plotting.
# ypreds = cross_val_predict(lasso, X, y, cv=5,n_jobs=-1,scoring='r2')
# ypreds = cross_val_predict(clf, X, y, cv=5,n_jobs=-1,scoring='recall')
from sklearn.model_selection import cross_val_predict
#------------------
# cv_results = cross_validate(lasso, X, y, cv=5,n_jobs=-1,scoring='r2')
# print(cv_results['test_score'])
from sklearn.metrics.scorer import make_scorer
from sklearn.model_selection import cross_validate
# sklearn scalar metrics
from sklearn.metrics import accuracy_score
from sklearn.metrics import precision_score
from sklearn.metrics import recall_score
from sklearn.metrics import f1_score
# multiple metrics
from sklearn.metrics import average_precision_score
from sklearn.metrics import precision_recall_fscore_support
# roc auc and curves
from sklearn.metrics import auc
from sklearn.metrics import roc_auc_score
from sklearn.metrics import roc_curve
from sklearn.metrics import precision_recall_curve
# confusion matrix and classification report
from sklearn.metrics import confusion_matrix
from sklearn.metrics import classification_report
# my local library
import sys
sys.path.append("/Users/poudel/Dropbox/a00_Bhishan_Modules/bhishan/")
from bhishan import bp
df = pd.read_csv('../data/raw/creditcard.csv.zip',compression='zip')
print(df.shape)
df.head()
(284807, 31)
Time | V1 | V2 | V3 | V4 | V5 | V6 | V7 | V8 | V9 | V10 | V11 | V12 | V13 | V14 | V15 | V16 | V17 | V18 | V19 | V20 | V21 | V22 | V23 | V24 | V25 | V26 | V27 | V28 | Amount | Class | |
---|---|---|---|---|---|---|---|---|---|---|---|---|---|---|---|---|---|---|---|---|---|---|---|---|---|---|---|---|---|---|---|
0 | 0.0 | -1.359807 | -0.072781 | 2.536347 | 1.378155 | -0.338321 | 0.462388 | 0.239599 | 0.098698 | 0.363787 | 0.090794 | -0.551600 | -0.617801 | -0.991390 | -0.311169 | 1.468177 | -0.470401 | 0.207971 | 0.025791 | 0.403993 | 0.251412 | -0.018307 | 0.277838 | -0.110474 | 0.066928 | 0.128539 | -0.189115 | 0.133558 | -0.021053 | 149.62 | 0 |
1 | 0.0 | 1.191857 | 0.266151 | 0.166480 | 0.448154 | 0.060018 | -0.082361 | -0.078803 | 0.085102 | -0.255425 | -0.166974 | 1.612727 | 1.065235 | 0.489095 | -0.143772 | 0.635558 | 0.463917 | -0.114805 | -0.183361 | -0.145783 | -0.069083 | -0.225775 | -0.638672 | 0.101288 | -0.339846 | 0.167170 | 0.125895 | -0.008983 | 0.014724 | 2.69 | 0 |
2 | 1.0 | -1.358354 | -1.340163 | 1.773209 | 0.379780 | -0.503198 | 1.800499 | 0.791461 | 0.247676 | -1.514654 | 0.207643 | 0.624501 | 0.066084 | 0.717293 | -0.165946 | 2.345865 | -2.890083 | 1.109969 | -0.121359 | -2.261857 | 0.524980 | 0.247998 | 0.771679 | 0.909412 | -0.689281 | -0.327642 | -0.139097 | -0.055353 | -0.059752 | 378.66 | 0 |
3 | 1.0 | -0.966272 | -0.185226 | 1.792993 | -0.863291 | -0.010309 | 1.247203 | 0.237609 | 0.377436 | -1.387024 | -0.054952 | -0.226487 | 0.178228 | 0.507757 | -0.287924 | -0.631418 | -1.059647 | -0.684093 | 1.965775 | -1.232622 | -0.208038 | -0.108300 | 0.005274 | -0.190321 | -1.175575 | 0.647376 | -0.221929 | 0.062723 | 0.061458 | 123.50 | 0 |
4 | 2.0 | -1.158233 | 0.877737 | 1.548718 | 0.403034 | -0.407193 | 0.095921 | 0.592941 | -0.270533 | 0.817739 | 0.753074 | -0.822843 | 0.538196 | 1.345852 | -1.119670 | 0.175121 | -0.451449 | -0.237033 | -0.038195 | 0.803487 | 0.408542 | -0.009431 | 0.798278 | -0.137458 | 0.141267 | -0.206010 | 0.502292 | 0.219422 | 0.215153 | 69.99 | 0 |
df['Class'].value_counts()
0 284315 1 492 Name: Class, dtype: int64
df['Class'].value_counts(normalize=True)*1000
0 998.272514 1 1.727486 Name: Class, dtype: float64
target = 'Class'
df_corr = df.drop(target,1).corrwith(df[target]).sort_values()
df_corr.plot.bar(figsize = (12, 8), title = "Correlation with class",
fontsize = 12,rot = 90, grid = True,
color=sns.color_palette('Reds_r',30),ylim=(-0.4,0.4)
)
# v17 14 12 and 10 has correlation more than 0.2
<matplotlib.axes._subplots.AxesSubplot at 0x10a21e048>
df_corr.loc[ abs(df_corr.values)>0.2]
V17 -0.326481 V14 -0.302544 V12 -0.260593 V10 -0.216883 dtype: float64
high_corr_idx = df_corr.loc[ abs(df_corr.values)>0.2].index.values.tolist()
high_corr_idx
['V17', 'V14', 'V12', 'V10']
def dist_plot():
for c in high_corr_idx:
sns.distplot(df[c],fit=scipy.stats.norm)
plt.xlim(-5,5)
plt.show()
plt.close()
dist_plot()
# clearly pdf is much different from gaussian distribution.
# to reduce skewness, we can we boxcox transform.
# RobustScaler is less prone to outliers.
from sklearn.preprocessing import StandardScaler, RobustScaler
scaler = RobustScaler()
df['scaled_amount'] = scaler.fit_transform(df['Amount'].values.reshape(-1,1))
df['scaled_time'] = scaler.fit_transform(df['Time'].values.reshape(-1,1))
def boxplots_with_outliers():
print('Before removing outliers from highest correlated features:')
for c in high_corr_idx:
plt.figure(figsize=(16,4))
sns.boxplot(df[c])
plt.show()
plt.close()
boxplots_with_outliers()
Before removing outliers from highest correlated features:
# Find outliers using IQR method
q1 = df[high_corr_idx].quantile(0.25)
q3 = df[high_corr_idx].quantile(0.75)
iqr = q3 - q1
threshold = 1.5
cond1 = df[high_corr_idx] < (q1 - threshold * iqr)
cond2 = df[high_corr_idx] > (q3 + threshold * iqr)
cond = cond1 | cond2
idx_no_outliers = df[high_corr_idx][~(cond).any(axis=1)].index
idx_no_outliers[:5]
Int64Index([0, 1, 2, 3, 4], dtype='int64')
df_no_outliers = df.loc[idx_no_outliers]
df.shape, df_no_outliers.shape
((284807, 33), (250883, 33))
def boxplots_no_outliers():
print('After removing outliers from highest correlated features:')
for c in high_corr_idx:
plt.figure(figsize=(16,4))
sns.boxplot(df_no_outliers[c])
plt.show()
plt.close()
boxplots_no_outliers()
After removing outliers from highest correlated features:
Cons:
# without removing outliers
n = df[target].value_counts().values[-1]
df_under = (df.groupby(target)
.apply(lambda x: x.sample(n,random_state=random_state))
.reset_index(drop=True)
)
df_under[target].value_counts()
1 492 0 492 Name: Class, dtype: int64
df.shape, df_under.shape
# out of 284k samples, we now have 984 samples for undersampling
# we have lost 283k samples and have only 1k samples
# this is a lot of information losss, but still I will test the
# classifiers with this undersampling method.
#
# Later, I will use oversampling methods to do the modelling.
((284807, 33), (984, 33))
df.columns
Index(['Time', 'V1', 'V2', 'V3', 'V4', 'V5', 'V6', 'V7', 'V8', 'V9', 'V10', 'V11', 'V12', 'V13', 'V14', 'V15', 'V16', 'V17', 'V18', 'V19', 'V20', 'V21', 'V22', 'V23', 'V24', 'V25', 'V26', 'V27', 'V28', 'Amount', 'Class', 'scaled_amount', 'scaled_time'], dtype='object')
(Xtrain_no_outliers, Xtest_no_outliers,
ytrain_no_outliers, ytest_no_outliers) = \
train_test_split(df_no_outliers.drop([target],1),
df_no_outliers[target],
random_state=random_state,
test_size=0.2,
stratify=df_no_outliers[target])
print(df.shape, Xtrain_no_outliers.shape, Xtest_no_outliers.shape)
columns = df_no_outliers.columns.difference([target]).values.tolist() + [target]
df_train_no_outliers = pd.DataFrame(data=np.c_[Xtrain_no_outliers,
ytrain_no_outliers],
columns=columns)
df_test_no_outliers = pd.DataFrame(data=np.c_[Xtest_no_outliers,
ytest_no_outliers],
columns=columns)
print(df.shape, df_train_no_outliers.shape, df_test_no_outliers.shape)
df_train_no_outliers.head(2)
(284807, 33) (200706, 32) (50177, 32) (284807, 33) (200706, 33) (50177, 33)
Amount | Time | V1 | V10 | V11 | V12 | V13 | V14 | V15 | V16 | V17 | V18 | V19 | V2 | V20 | V21 | V22 | V23 | V24 | V25 | V26 | V27 | V28 | V3 | V4 | V5 | V6 | V7 | V8 | V9 | scaled_amount | scaled_time | Class | |
---|---|---|---|---|---|---|---|---|---|---|---|---|---|---|---|---|---|---|---|---|---|---|---|---|---|---|---|---|---|---|---|---|---|
0 | 153336.0 | 2.063767 | -0.488559 | -1.799317 | 0.518851 | 0.130354 | -0.503761 | 0.113631 | -0.224508 | -0.970983 | 1.241842 | -0.060205 | 0.170743 | -0.692233 | 0.700893 | -1.251801 | -1.867572 | -0.254898 | 1.432933 | -0.518657 | -0.657286 | -0.279769 | -0.254201 | -0.013790 | -0.608267 | 0.344953 | -0.476448 | -0.004394 | -0.067904 | 43.40 | 0.299029 | 0.806447 | 0.0 |
1 | 69329.0 | 1.237906 | 0.265153 | 0.180927 | 0.504037 | -0.193144 | -0.571533 | -0.055028 | -0.009820 | -0.136239 | -0.099655 | 1.261914 | 0.575181 | -0.252796 | -0.020983 | 0.466912 | 0.791755 | -0.349610 | 0.358501 | 0.218193 | -0.089781 | -0.263224 | -0.814410 | 0.082531 | -0.049334 | 0.214859 | 0.098921 | -0.030103 | 0.016190 | 0.89 | -0.294977 | -0.180488 | 0.0 |
(Xtrain_under, Xtest_under,
ytrain_under, ytest_under) = \
train_test_split(df_under.drop([target],1),
df_under[target],
random_state=random_state,
test_size=0.2,
#stratify=df_under[target] # do no use stratify here.
)
print(df.shape, Xtrain_under.shape, Xtest_under.shape)
columns = df_no_outliers.columns.difference([target]).values.tolist() + [target]
df_train_under = pd.DataFrame(data=np.c_[Xtrain_under,
ytrain_under],
columns=columns)
df_test_under = pd.DataFrame(data=np.c_[Xtest_under
,ytest_under],
columns=columns)
print(df.shape, df_train_under.shape, df_test_under.shape)
df_train_under.head(2)
(284807, 33) (787, 32) (197, 32) (284807, 33) (787, 33) (197, 33)
Amount | Time | V1 | V10 | V11 | V12 | V13 | V14 | V15 | V16 | V17 | V18 | V19 | V2 | V20 | V21 | V22 | V23 | V24 | V25 | V26 | V27 | V28 | V3 | V4 | V5 | V6 | V7 | V8 | V9 | scaled_amount | scaled_time | Class | |
---|---|---|---|---|---|---|---|---|---|---|---|---|---|---|---|---|---|---|---|---|---|---|---|---|---|---|---|---|---|---|---|---|---|
0 | 147856.0 | 1.915851 | 0.665687 | -0.884928 | 3.489039 | 0.842344 | 0.315856 | 0.220146 | -0.016990 | -1.539009 | 1.678634 | 0.800689 | 0.763875 | 0.839985 | 0.430142 | -1.024695 | 1.021889 | -1.179907 | 0.101768 | -1.527063 | -0.210279 | 0.289098 | 0.828991 | 0.088947 | 0.716084 | 0.127340 | 0.079675 | -0.045138 | -0.054328 | 0.00 | -0.307413 | 0.742067 | 0.0 |
1 | 155662.0 | -1.928613 | 4.601506 | -7.124053 | 5.716088 | 1.026579 | -3.189073 | -2.261897 | 1.185096 | -4.441942 | -6.646154 | 3.827868 | -6.518649 | 0.251137 | -12.456706 | -0.649166 | -1.283145 | -2.718560 | -0.085466 | -2.097385 | 0.328796 | 0.602291 | -0.541287 | -0.354639 | -0.701492 | -0.030973 | 0.034070 | 0.573393 | 0.294686 | 0.77 | -0.296653 | 0.833774 | 1.0 |
df_train_under['Class'].value_counts()
1.0 401 0.0 386 Name: Class, dtype: int64
df_test_under['Class'].value_counts()
0.0 106 1.0 91 Name: Class, dtype: int64
for x in [df, df_under, df_no_outliers,
df_train_under, df_test_under,
df_train_no_outliers, df_test_no_outliers]:
print(x.isnull().sum().sum())
0 0 0 0 0 0 0
df_under.columns
Index(['Time', 'V1', 'V2', 'V3', 'V4', 'V5', 'V6', 'V7', 'V8', 'V9', 'V10', 'V11', 'V12', 'V13', 'V14', 'V15', 'V16', 'V17', 'V18', 'V19', 'V20', 'V21', 'V22', 'V23', 'V24', 'V25', 'V26', 'V27', 'V28', 'Amount', 'Class', 'scaled_amount', 'scaled_time'], dtype='object')
df_train_under.columns
Index(['Amount', 'Time', 'V1', 'V10', 'V11', 'V12', 'V13', 'V14', 'V15', 'V16', 'V17', 'V18', 'V19', 'V2', 'V20', 'V21', 'V22', 'V23', 'V24', 'V25', 'V26', 'V27', 'V28', 'V3', 'V4', 'V5', 'V6', 'V7', 'V8', 'V9', 'scaled_amount', 'scaled_time', 'Class'], dtype='object')
</div>
from sklearn.linear_model import LogisticRegression
from sklearn.svm import SVC
from sklearn.neighbors import KNeighborsClassifier
from sklearn.tree import DecisionTreeClassifier
from sklearn.ensemble import RandomForestClassifier
features_with_log = df_under.columns.difference(
['Amount','Time','Class']).values.tolist()
features = features_with_log
print(features)
['V1', 'V10', 'V11', 'V12', 'V13', 'V14', 'V15', 'V16', 'V17', 'V18', 'V19', 'V2', 'V20', 'V21', 'V22', 'V23', 'V24', 'V25', 'V26', 'V27', 'V28', 'V3', 'V4', 'V5', 'V6', 'V7', 'V8', 'V9', 'scaled_amount', 'scaled_time']
# numpy arrays
Xtrain = df_train_under[features].values
Xtest = df_test_under[features].values
ytrain = df_train_under[target].values.ravel()
ytest = df_test_under[target].values.ravel()
Xtrain.shape, ytrain.shape, Xtest.shape, ytest.shape
((787, 30), (787,), (197, 30), (197,))
clf_lr = LogisticRegression(solver='liblinear',
max_iter=4000,
random_state=random_state,
n_jobs=1,) # for liblinear n_jobs is +1.
clf_svc = SVC(random_state=random_state,gamma='scale')
clf_knn = KNeighborsClassifier(n_jobs=-1)
clf_dtc = DecisionTreeClassifier(random_state=random_state)
clf_rfc = RandomForestClassifier(n_estimators=100,
random_state=random_state,n_jobs=-1)
clf_names = ["Logisitic Regression","Support Vector Classifier",
"KNN", "Decision Tree Classifier","Random Forest Classifier"]
X = df_under[features_with_log].values
y = df_under[target].values.ravel()
from sklearn.model_selection import cross_val_score
classifiers = [clf_lr, clf_svc, clf_knn, clf_dtc, clf_rfc]
recall_cross_val_scores = []
t0 = time.time()
for clf in classifiers:
clf.fit(X, y)
score = cross_val_score(clf, X, y, cv=5,n_jobs=-1,scoring='recall')
recall_cross_val_scores.append(score.mean())
t1 = (time.time() - t0)
print('Time taken: {} minutes {:.2f} seconds'.format(*divmod(t1,60)))
df_recall_cross_val_scores = pd.DataFrame({'Classifier': clf_names,
'Recall Cross Validation Score': recall_cross_val_scores})
df_recall_cross_val_scores = df_recall_cross_val_scores\
.sort_values('Recall Cross Validation Score',ascending=False)
df_recall_cross_val_scores.index = range(len(df_recall_cross_val_scores))
df_recall_cross_val_scores.style.background_gradient(
subset=['Recall Cross Validation Score']).set_caption(
'Recall Cross Validation Scores for Default Classifiers for Undersampled Data')
Time taken: 0.0 minutes 1.13 seconds
Classifier | Recall Cross Validation Score | |
---|---|---|
0 | Logisitic Regression | 0.896269 |
1 | Random Forest Classifier | 0.896269 |
2 | Decision Tree Classifier | 0.894228 |
3 | KNN | 0.894207 |
4 | Support Vector Classifier | 0.871841 |
from sklearn.model_selection import cross_val_predict
from sklearn.metrics import roc_auc_score
# logistic regression and svc have method decision function
cvpred_lr = cross_val_predict(clf_lr, X, y, cv=5,n_jobs=-1,
method="decision_function")
cvpred_svc = cross_val_predict(clf_svc, X, y, cv=5,n_jobs=-1,
method="decision_function")
# default cross val predict method is 'predict_proba' to get probs
cvprob_knn = cross_val_predict(clf_knn, X, y, cv=5,n_jobs=-1,method='predict_proba')
cvprob_dtc = cross_val_predict(clf_dtc, X, y, cv=5,n_jobs=-1,method='predict_proba')
cvprob_rfc = cross_val_predict(clf_rfc, X, y, cv=5,n_jobs=-1,method='predict_proba')
all_cross_val_probs = [cvprob_lr, cvprob_svc, cvprob_knn, cvprob_dtc, cvprob_rfc]
all_roc_auc_scores = [roc_auc_score(y, cvprob)
for cvprob in all_cross_val_probs ]
# create dataframe of results
col = 'Cross Validation AUROC Scores'
df_cross_val_preds = pd.DataFrame({'Classifier': clf_names,
col: all_roc_auc_scores})
df_cross_val_preds = df_cross_val_preds.sort_values(col,ascending=False)
df_cross_val_preds.index = range(len(df_cross_val_preds))
title = 'Cross Validation AUROC Scores for Default Classifiers '
title += 'for Undersampled Data'
df_cross_val_preds.style.background_gradient(subset=[col])\
.set_caption(title)
Classifier | Cross Validation AUROC Scores | |
---|---|---|
0 | Support Vector Classifier | 0.979885 |
1 | Logisitic Regression | 0.975118 |
2 | Random Forest Classifier | 0.930894 |
3 | KNN | 0.930894 |
4 | Decision Tree Classifier | 0.889228 |
cvpred_lr[:5]
from sklearn.model_selection import GridSearchCV, RandomizedSearchCV
def get_best_estimator(clf, params,Xtrain,ytrain,fname=None,
random_state=100,
verbose=1,
use_gridcv=True,
scoring='recall'):
"""Find the best estimator using grid search.
GridSearchCV does not have random_state, it goes through all the
parameters given to it. It is slow but guarenteed to give best among them.
RandomizedSearchCV do have random_state. It is fast
but is not guarenteed to give the best set of params among them.
"""
import time
from sklearn.model_selection import GridSearchCV, RandomizedSearchCV
t0 = time.time()
if use_gridcv:
# GridSearchCV does not have random_state and n_iter
print('Please wait .. doing grid search cv')
grid = GridSearchCV(clf, params,cv=5,n_jobs=-1,
verbose=verbose,scoring=scoring)
else:
print('Please wait .. doing randomized search cv')
grid = RandomizedSearchCV(clf, params,cv=5,n_jobs=-1,n_iter=10,
verbose=verbose,scoring=scoring,
random_state=random_state)
grid.fit(Xtrain, ytrain)
clf_best = grid.best_estimator_
if fname:
joblib.dump(clf_best, fname)
t1 = time.time() - t0
print('Time taken: {:.0f} min {:.0f} secs'.format(*divmod(t1,60)))
return clf_best
# Logistic Regression
# liblinear supports penalty l1 and l2, but lbfgs support only l2.
# generally we choose C in log scale.
params_lr = {"penalty": ['l1', 'l2'],
'C': [0.001, 0.01, 0.1, 1, 10, 100, 1000]}
fname = '../models/serialization/clf_best_lr.pkl'
# clf_best_lr = get_best_estimator(clf_lr, params_lr,Xtrain,ytrain,fname)
# After getting the best classifier, comment the code.
# Time taken: 3 min 28 secs for gridsearch
fname = '../models/serialization/clf_best_lr.pkl'
clf_best_lr = joblib.load(fname)
clf_best_lr
LogisticRegression(C=0.001, class_weight=None, dual=False, fit_intercept=True, intercept_scaling=1, l1_ratio=None, max_iter=4000, multi_class='warn', n_jobs=1, penalty='l1', random_state=100, solver='liblinear', tol=0.0001, verbose=0, warm_start=False)
# Support Vector Classifier
params_svc = {'C': [0.5, 0.7, 0.9, 1],
'kernel': ['rbf', 'poly', 'sigmoid', 'linear']}
fname = '../models/serialization/clf_best_svc.pkl'
# clf_best_svc = get_best_estimator(clf_svc,params_svc,Xtrain,ytrain,fname)
# Time taken: Time taken: 1 min 4 secs
fname = '../models/serialization/clf_best_svc.pkl'
clf_best_svc = joblib.load(fname)
# K-nearest neighbor
params_knn = {"n_neighbors": list(range(2,5,1)),
'algorithm': ['auto', 'ball_tree', 'kd_tree', 'brute']}
fname = '../models/serialization/clf_best_knn.pkl'
clf_best_knn = get_best_estimator(clf_knn, params_knn,Xtrain,ytrain,fname)
# Time taken: 0 min 3 secs
Please wait .. doing grid search cv Fitting 5 folds for each of 12 candidates, totalling 60 fits
[Parallel(n_jobs=-1)]: Using backend LokyBackend with 4 concurrent workers.
Time taken: 0 min 2 secs
[Parallel(n_jobs=-1)]: Done 60 out of 60 | elapsed: 1.8s finished
# DecisionTree Classifier
params_dtc = {"criterion": ["gini", "entropy"],
"max_depth": list(range(2,4,1)),
"min_samples_leaf": list(range(5,7,1))}
fname = '../models/serialization/clf_best_dtree.pkl'
clf_best_dtc = get_best_estimator(clf_dtc, params_dtc,Xtrain,ytrain,fname)
# Time taken: 0 min 2 secs
[Parallel(n_jobs=-1)]: Using backend LokyBackend with 4 concurrent workers.
Please wait .. doing grid search cv Fitting 5 folds for each of 8 candidates, totalling 40 fits Time taken: 0 min 0 secs
[Parallel(n_jobs=-1)]: Done 40 out of 40 | elapsed: 0.2s finished
# Random Forest Classifier
clf_rfc = RandomForestClassifier(random_state=random_state)
n_estimators = [200,500,1000,1500,2000]
max_depth = [10,20,40,80,100,120]
max_features = ['auto', 'sqrt']
bootstrap = [True, False]
min_samples_split = [2, 5, 10]
min_samples_leaf = [1, 2, 4]
params_rfc = {'n_estimators': n_estimators,
'max_features': max_features,
'max_depth': max_depth,
'min_samples_split': min_samples_split,
'min_samples_leaf': min_samples_leaf,
'bootstrap': bootstrap}
fname = '../models/serialization/clf_best_rfc.pkl'
clf_best_rfc = get_best_estimator(clf_rfc, params_rfc,Xtrain,ytrain,fname,
use_gridcv=False)
# Time taken: 0 min 48 secs
Please wait .. doing randomized search cv Fitting 5 folds for each of 10 candidates, totalling 50 fits
[Parallel(n_jobs=-1)]: Using backend LokyBackend with 4 concurrent workers. [Parallel(n_jobs=-1)]: Done 42 tasks | elapsed: 34.6s [Parallel(n_jobs=-1)]: Done 50 out of 50 | elapsed: 37.6s finished
Time taken: 0 min 43 secs
fname = '../models/serialization/clf_best_rfc.pkl'
clf_best_rfc = joblib.load(fname)
ypreds_lr = clf_lr.predict(Xtest)
ypreds_svc = clf_svc.predict(Xtest)
ypreds_knn = clf_knn.predict(Xtest)
ypreds_dtc = clf_dtc.predict(Xtest)
ypreds_rfc = clf_rfc.predict(Xtest)
df_false_negatives = get_false_negative_frauds('Logistic Regression',
ytest,ypreds_lr,
desc="Undersample",
df_false_negatives=None,
show=False);
df_false_negatives = get_false_negative_frauds('Support Vector Classifier',
ytest,ypreds_svc,
desc="Undersample",
df_false_negatives=df_false_negatives,
show=False);
df_false_negatives = get_false_negative_frauds('KNN',
ytest,ypreds_knn,
desc="Undersample",
df_false_negatives=df_false_negatives,
show=False);
df_false_negatives = get_false_negative_frauds('Decision Tree Classifier',
ytest,ypreds_dtc,
desc="Undersample",
df_false_negatives=df_false_negatives,
show=False);
df_false_negatives = get_false_negative_frauds('Random Forest Classifier',
ytest,ypreds_rfc,
desc="Undersample",
df_false_negatives=df_false_negatives,
show=True);
Model | Description | Total_Frauds | Incorrect_Frauds | Incorrect_Percent | |
---|---|---|---|---|---|
0 | Support Vector Classifier | Undersample | 91 | 12 | 13.19 % |
1 | Random Forest Classifier | Undersample | 91 | 17 | 18.68 % |
2 | Decision Tree Classifier | Undersample | 91 | 19 | 20.88 % |
3 | Logistic Regression | Undersample | 91 | 39 | 42.86 % |
4 | KNN | Undersample | 91 | 61 | 67.03 % |
ypreds_best_lr = clf_best_lr.predict(Xtest)
ypreds_best_svc = clf_best_svc.predict(Xtest)
ypreds_best_knn = clf_best_knn.predict(Xtest)
ypreds_best_dtc = clf_best_dtc.predict(Xtest)
ypreds_best_rfc = clf_best_rfc.predict(Xtest)
from sklearn.metrics import accuracy_score
from sklearn.metrics import precision_score
from sklearn.metrics import recall_score
from sklearn.metrics import f1_score
from bhishan.util_model_eval import get_binary_classification_scalar_metrics
df_eval = get_binary_classification_scalar_metrics(
"Logistic Regression",
clf_best_lr,
Xtest,ytest,
ypreds_best_lr,
desc="Undersample, Grid Search", df_eval=None,show=False)
df_eval = get_binary_classification_scalar_metrics(
'Support Vector Classifier',
clf_best_svc,
Xtest,ytest,
ypreds_best_lr,
desc="Undersample, Grid Search", df_eval=df_eval,show=False)
df_eval = get_binary_classification_scalar_metrics(
'KNN',
clf_best_knn,
Xtest,ytest,
ypreds_best_knn,
desc="Undersample, Grid Search", df_eval=df_eval,show=False)
df_eval = get_binary_classification_scalar_metrics(
'Decision Tree Classifier',
clf_best_dtc,
Xtest,ytest,
ypreds_best_dtc,
desc="Undersample, Grid Search", df_eval=df_eval,show=False)
df_eval = get_binary_classification_scalar_metrics(
'Random Forest Classifier',
clf_best_rfc,
Xtest,ytest,
ypreds_best_rfc,
desc="Undersample, Grid Search", df_eval=df_eval)
Model | Description | Accuracy | Precision | Recall | F1 | Mathews Correlation Coefficient | Cohens Kappa | Area Under Precision Curve | Area Under ROC Curve | |
---|---|---|---|---|---|---|---|---|---|---|
0 | Logistic Regression | Undersample, Grid Search | 0.741117 | 0.651515 | 0.945055 | 0.7713 | 0.541913 | 0.495303 | 0.95003 | 0.931474 |
1 | Support Vector Classifier | Undersample, Grid Search | 0.741117 | 0.651515 | 0.945055 | 0.7713 | 0.541913 | 0.495303 | 0.962546 | 0.94464 |
2 | Random Forest Classifier | Undersample, Grid Search | 0.913706 | 0.95122 | 0.857143 | 0.901734 | 0.828738 | 0.825181 | 0.981182 | 0.977918 |
3 | KNN | Undersample, Grid Search | 0.888325 | 0.915663 | 0.835165 | 0.873563 | 0.776569 | 0.773941 | 0.903222 | 0.93163 |
4 | Decision Tree Classifier | Undersample, Grid Search | 0.898477 | 0.949367 | 0.824176 | 0.882353 | 0.79999 | 0.793847 | 0.903238 | 0.931371 |
from sklearn.metrics import accuracy_score, precision_score, recall_score, f1_score
print('Accuracy: ', accuracy_score(ytest,ypreds_best_lr))
print('Precision: ', precision_score(ytest,ypreds_best_lr))
print('Recall: ', recall_score(ytest,ypreds_best_lr))
print('F1-score: ', f1_score(ytest,ypreds_best_lr))
Accuracy: 0.7411167512690355 Precision: 0.6515151515151515 Recall: 0.945054945054945 F1-score: 0.7713004484304932
from sklearn.metrics import classification_report
from bhishan.util_model_eval import get_binary_classification_report
df_clf_report = get_binary_classification_report("Logistic Regression",
ytest,
ypreds_best_lr,
desc='Undersample, Grid Search',
style_col='Recall_1',
df_clf_report=None,show=False)
df_clf_report = get_binary_classification_report("Support Vector Classifier",
ytest,
ypreds_best_svc,
desc='Undersample, Grid Search',
style_col='Recall_1',
df_clf_report=df_clf_report,show=False)
df_clf_report = get_binary_classification_report("KNN",
ytest,
ypreds_best_knn,
desc='Undersample, Grid Search',
style_col='Recall_1',
df_clf_report=df_clf_report,show=False)
df_clf_report = get_binary_classification_report("Decision Tree Classifier",
ytest,
ypreds_best_dtc,
desc='Undersample, Grid Search',
style_col='Recall_1',
df_clf_report=df_clf_report,show=False)
df_clf_report = get_binary_classification_report("Random Forest Classifier",
ytest,
ypreds_best_rfc,
desc='Undersample, Grid Search',
style_col='Recall_1',
df_clf_report=df_clf_report,show=True)
Model | Desc | Precision_0 | Precision_1 | Recall_0 | Recall_1 | F1_Score_0 | F1_Score_1 | Support_0 | Support_1 | |
---|---|---|---|---|---|---|---|---|---|---|
0 | Logistic Regression | Undersample, Grid Search | 0.923077 | 0.651515 | 0.566038 | 0.945055 | 0.701754 | 0.7713 | 106 | 91 |
1 | Support Vector Classifier | Undersample, Grid Search | 0.901786 | 0.941176 | 0.95283 | 0.879121 | 0.926606 | 0.909091 | 106 | 91 |
4 | Random Forest Classifier | Undersample, Grid Search | 0.886957 | 0.95122 | 0.962264 | 0.857143 | 0.923077 | 0.901734 | 106 | 91 |
2 | KNN | Undersample, Grid Search | 0.868421 | 0.915663 | 0.933962 | 0.835165 | 0.9 | 0.873563 | 106 | 91 |
3 | Decision Tree Classifier | Undersample, Grid Search | 0.864407 | 0.949367 | 0.962264 | 0.824176 | 0.910714 | 0.882353 | 106 | 91 |
print(classification_report(ytest, ypreds_best_lr))
precision recall f1-score support 0.0 0.92 0.57 0.70 106 1.0 0.65 0.95 0.77 91 accuracy 0.74 197 macro avg 0.79 0.76 0.74 197 weighted avg 0.80 0.74 0.73 197
from sklearn.metrics import confusion_matrix
from bhishan.util_model_eval import print_confusion_matrix_frauds
from bhishan.util_model_eval import plot_confusion_matrix_plotly
print_confusion_matrix_frauds(
"Logistic Regression, Undersample, Grid Search",
ytest,ypreds_best_lr)
Predicted_No_Fraud | Predicted_Fraud | Total_Frauds | Correct_Frauds | Incorrect_Frauds | Fraud_Detection | |
---|---|---|---|---|---|---|
No_Fraud | 60 | 46 | 91 | 86 | 5 | 94.51% |
Fraud | 5 | 86 | 91 | 86 | 5 | 94.51% |
print_confusion_matrix_frauds(
"Random Forest Classifier, Undersample, Grid Search",
ytest,ypreds_best_rfc)
Predicted_No_Fraud | Predicted_Fraud | Total_Frauds | Correct_Frauds | Incorrect_Frauds | Fraud_Detection | |
---|---|---|---|---|---|---|
No_Fraud | 102 | 4 | 91 | 78 | 13 | 85.71% |
Fraud | 13 | 78 | 91 | 78 | 13 | 85.71% |
plot_confusion_matrix_plotly(ytest, ypreds_best_lr)
confusion_matrix(ytest, ypreds_best_lr)
array([[60, 46], [ 5, 86]])
# help(confusion_matrix)
tn, fp, fn, tp = confusion_matrix(ytest, ypreds_best_lr).ravel()
tn, fp, fn, tp
(60, 46, 5, 86)
df_ytest_ypreds = pd.DataFrame({'ytest': ytest,
'ypreds': ypreds_best_lr})
df_ytest_ypreds.head()
ytest | ypreds | |
---|---|---|
0 | 1.0 | 0.0 |
1 | 1.0 | 1.0 |
2 | 0.0 | 0.0 |
3 | 1.0 | 1.0 |
4 | 1.0 | 1.0 |
df_ytest_ypreds.query("ytest == 1.0 and ypreds == 0.0")
ytest | ypreds | |
---|---|---|
0 | 1.0 | 0.0 |
28 | 1.0 | 0.0 |
76 | 1.0 | 0.0 |
166 | 1.0 | 0.0 |
185 | 1.0 | 0.0 |
df_ytest_ypreds.query("ytest == 1.0 and ypreds == 0.0").shape
(5, 2)
from bhishan.util_model_eval import get_false_negative_frauds
df_false_negatives = get_false_negative_frauds('Logistic Regression',
ytest,ypreds_best_lr,
desc="Undersample, grid search",
df_false_negatives=None,
show=False);
df_false_negatives = get_false_negative_frauds('Support Vector Classifier',
ytest,ypreds_best_svc,
desc="Undersample, grid search",
df_false_negatives=df_false_negatives,
show=False);
df_false_negatives = get_false_negative_frauds('KNN',
ytest,ypreds_best_knn,
desc="Undersample, grid search",
df_false_negatives=df_false_negatives,
show=False);
df_false_negatives = get_false_negative_frauds('Decision Tree Classifier',
ytest,ypreds_best_dtc,
desc="Undersample, grid search",
df_false_negatives=df_false_negatives,
show=False);
df_false_negatives = get_false_negative_frauds('Random Forest Classifier',
ytest,ypreds_best_rfc,
desc="Undersample, grid search",
df_false_negatives=df_false_negatives,
show=True);
Model | Description | Total_Frauds | Incorrect_Frauds | Incorrect_Percent | |
---|---|---|---|---|---|
0 | Logistic Regression | Undersample, grid search | 91 | 5 | 5.49 % |
1 | Support Vector Classifier | Undersample, grid search | 91 | 11 | 12.09 % |
2 | Random Forest Classifier | Undersample, grid search | 91 | 13 | 14.29 % |
3 | KNN | Undersample, grid search | 91 | 15 | 16.48 % |
4 | Decision Tree Classifier | Undersample, grid search | 91 | 16 | 17.58 % |
from bhishan.util_model_eval import plot_roc_skf
clf_best_lr
LogisticRegression(C=0.001, class_weight=None, dual=False, fit_intercept=True, intercept_scaling=1, l1_ratio=None, max_iter=4000, multi_class='warn', n_jobs=1, penalty='l1', random_state=100, solver='liblinear', tol=0.0001, verbose=0, warm_start=False)
X = df_under[features_with_log].values
y = df_under[target].values
clf_lr = LogisticRegression(C=0.001, class_weight=None, dual=False,
fit_intercept=True,
intercept_scaling=1, l1_ratio=None, max_iter=4000,
multi_class='warn', n_jobs=1, penalty='l1',
random_state=100,
solver='liblinear', tol=0.0001, verbose=0,
warm_start=False)
ofile = '../reports/figures/cv_auroc_lr_undersample_grid.png'
plot_roc_skf(clf_lr, X,y,random_state=random_state,ofile=ofile)
from sklearn.model_selection import cross_val_predict
from sklearn.metrics import roc_auc_score
from sklearn.metrics import roc_curve
def plot_roc_curve(clf_names, all_roc_auc_scores, all_cross_val_probs, y,ofile=None):
"""Plot Receiver Operating Characteristic (ROC) curve.
NOTE:
In cross-validation we do not need Xtrain and Xtest,
one split of X is taken as Xtest and remaining splits are taken as Xtrain.
Example:
---------
"""
from sklearn.model_selection import cross_val_predict
from sklearn.metrics import roc_auc_score
from sklearn.metrics import roc_curve
labels = ['{}: {:.4f}'.format(clf,pred)
for clf,pred in zip(clf_names,all_roc_auc_scores)]
fpr_tpr_threshold = [ roc_curve(y, pred_x)
for pred_x in all_cross_val_probs ]
plt.figure(figsize=(12,8))
for i in range(len(fpr_tpr_threshold)):
plt.plot(fpr_tpr_threshold[i][0],
fpr_tpr_threshold[i][1],
label=labels[i])
plt.plot([0, 1], [0, 1], 'k--')
plt.axis([-0.01, 1, 0, 1])
plt.xlabel('False Positive Rate (FPR)', fontsize=16)
plt.ylabel('True Positive Rate (TPR)', fontsize=16)
plt.annotate('Minimum ROC Score of 50%',
xy=(0.5, 0.5), xytext=(0.6, 0.3),
arrowprops=dict(facecolor='#6E726D', shrink=0.05),
)
plt.title('ROC Curves',fontsize=20)
plt.legend()
plt.tight_layout()
# save the figure
if ofile:
plt.savefig(ofile,dpi=300)
# show the figure
plt.show()
plt.close()
t0 = time.time()
clf_names = ["Logisitic Regression","Support Vector Classifier",
"KNN", "Decision Tree Classifier","Random Forest Classifier"]
cvprob_lr = cross_val_predict(clf_best_lr, X, y, cv=5,
method="decision_function")
cvprob_svc = cross_val_predict(clf_best_svc, X, y, cv=5,
method="decision_function")
cvprob_knn = cross_val_predict(clf_best_knn,X,y,cv=5,method='predict_proba')
cvprob_dtc = cross_val_predict(clf_best_dtc,X,y,cv=5,method='predict_proba')
cvprob_rfc = cross_val_predict(clf_best_rfc, X, y, cv=5,method='predict_proba')
all_cross_val_probs = [cvprob_lr, cvprob_svc,
cvprob_knn, cvprob_dtc, cvprob_rfc]
all_roc_auc_scores = [roc_auc_score(y, cvprob)
for cvprob in all_cross_val_probs ]
ofile = '../reports/figures/roc_curves_for_all_clf.png'
plot_roc_curve(clf_names, all_roc_auc_scores,y,ofile=ofile)
t1 = time.time() - t0
print('Time taken: {:.0f} min {:.0f} secs'.format(*divmod(t1,60)))
# Time taken: 0 min 24 secs
Time taken: 0 min 24 secs
import plotly
plotly.__version__
'3.10.0'
yscore_best_lr = clf_best_lr.decision_function(Xtest)
ofile = '../reports/html/logistic_regression_model_evaluation.html'
pb.plotly_binary_clf_evaluation('clf_best_lr',clf_best_lr,ytest,
ypreds_best_lr,yscore_best_lr,
df_under,ofile=ofile,show=False)
bp.plotly_binary_clf_evaluation('clf_best_lr',clf_best_lr,ytest,
ypreds_best_lr,yscore_best_lr,
df_under[features_with_log],show=True)
features = df.columns.difference(['Amount','Time','Class']).values
fname = '../models/serialization/clf_best_rfc.pkl'
clf_best_rfc = joblib.load(fname)
df_imp = pd.DataFrame(data=clf_best_rfc.feature_importances_,
index=features).sort_values(by=0,ascending=False)
df_imp.plot.bar(figsize=(8,4))
plt.tight_layout()
plt.savefig('../reports/clf_best_rfc_feature_importances.png', dpi=300)