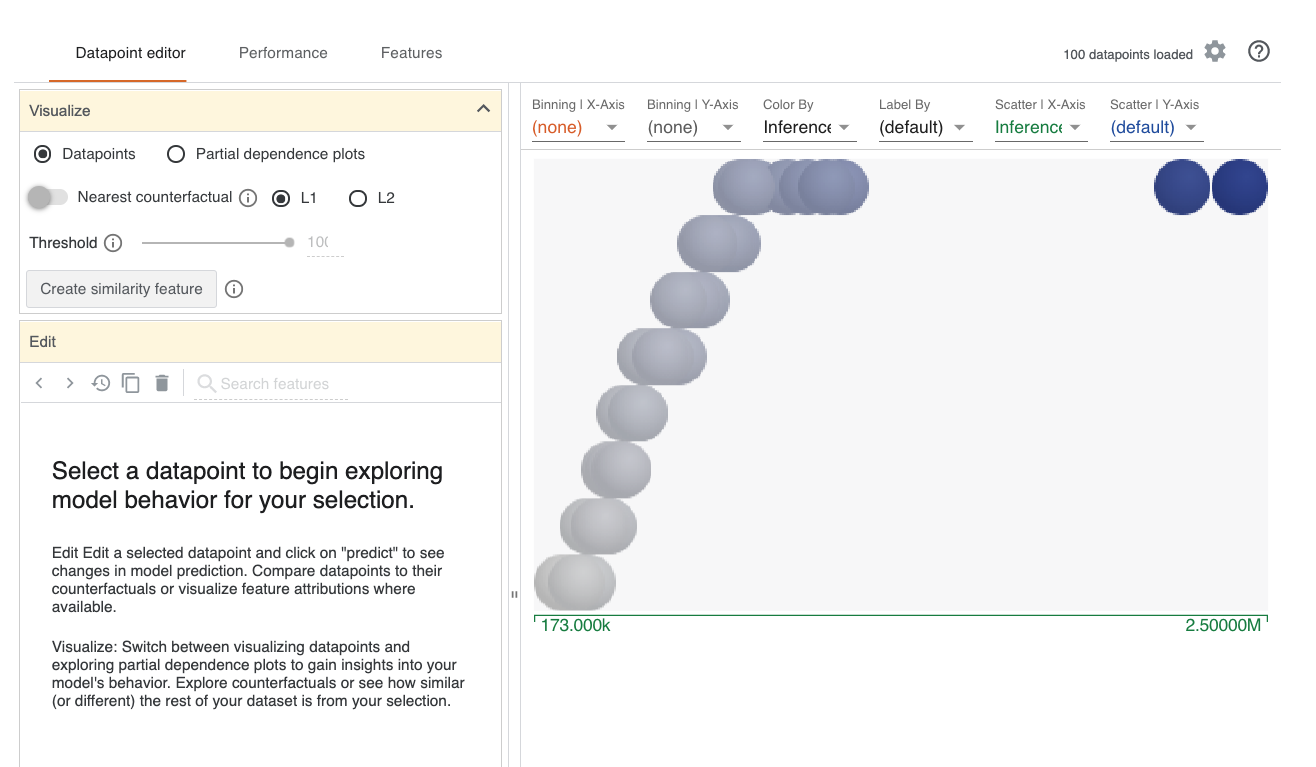
What If Tool (WIT) is developed by Google for model explanation. Here, we use the tool for xgboost model interpretation.
import time
time_start_notebook = time.time()
%%capture
import os
import sys
ENV_COLAB = 'google.colab' in sys.modules

if ENV_COLAB:
    ## install modules
    !pip install watermark
    !pip install --upgrade witwidget

    # if we update existing module, we need to restart colab
    !pip install -U scikit-learn

    ## print
    print('Environment: Google Colaboratory.')
TREE_METHOD = 'gpu_hist' if ENV_COLAB else 'auto'
import numpy as np
import pandas as pd
import xgboost
import sklearn
from sklearn import metrics as skmetrics

# model eval
import witwidget
from witwidget.notebook.visualization import WitConfigBuilder
from witwidget.notebook.visualization import WitWidget

# random state
SEED = 0
RNG = np.random.RandomState(SEED)

# versions
import watermark
%load_ext watermark
%watermark -a "Bhishan Poudel" -d -v -m
print()
%watermark -iv
The watermark extension is already loaded. To reload it, use:
  %reload_ext watermark
Bhishan Poudel 2020-11-21

CPython 3.7.9
IPython 7.18.1

compiler   : Clang 10.0.0
system     : Darwin
release    : 19.6.0
machine    : x86_64
processor  : i386
CPU cores  : 4
interpreter: 64bit

xgboost   1.2.0
sklearn   0.23.2
json      2.0.9
watermark 2.0.2
pandas    1.1.2
numpy     1.18.5
def adjustedR2(rsquared,nrows,ncols):
    return rsquared- (ncols-1)/(nrows-ncols) * (1-rsquared)

def print_regr_eval(ytest,ypreds,ncols):
    rmse = np.sqrt(skmetrics.mean_squared_error(ytest,ypreds))
    r2 = skmetrics.r2_score(ytest,ypreds)
    ar2 = adjustedR2(r2,len(ytest),ncols)
    evs = skmetrics.explained_variance_score(ytest, ypreds)

    print(f"""
             RMSE : {rmse:,.2f}
Explained Variance: {evs:.6f}
         R-Squared: {r2:,.6f}
Adjusted R-squared: {ar2:,.6f}

""")
if ENV_COLAB:
    path_git = 'https://raw.githubusercontent.com/bhishanpdl/Datasets/master/'
    project = 'Projects/King_County_Seattle_House_Price_Kaggle/'
    data_path_parent = path_git + project
else:
    data_path_parent = '../data/'


data_path_Xtest = data_path_parent + 'processed/Xtest.csv.zip'
data_path_ytest = data_path_parent + 'processed/ytest.csv'
target = 'price'
train_size = 0.8

print(data_path_Xtest)
../data/processed/Xtest.csv.zip
# Here, we only need test data
df_Xtest  = pd.read_csv(data_path_Xtest,compression='zip')
ser_ytest = pd.read_csv(data_path_ytest,header=None)
ytest  = np.array(ser_ytest).flatten()
features = list(df_Xtest.columns)

s = f"""
df_Xtest  = {df_Xtest.shape}
ytest     = {ytest.shape}

"""
print(s)

display(df_Xtest.head(2))
display(ser_ytest.head(2))

assert df_Xtest.shape[0] == ytest.shape[0]
df_Xtest  = (4323, 67)
ytest     = (4323,)
| age | age_after_renovation | age_after_renovation_cat | age_after_renovation_sq | age_cat | age_sq | basement_bool | bathrooms | bathrooms_sq | bedrooms | ... | view_sq | waterfront | waterfront_0 | waterfront_1 | waterfront_sq | yr_built | yr_renovated | yr_renovated2 | yr_sales | zipcode | |
|---|---|---|---|---|---|---|---|---|---|---|---|---|---|---|---|---|---|---|---|---|---|
| 0 | -1.372335 | -1.316486 | -1.265291 | -0.845091 | -1.320662 | -0.885667 | -0.801818 | 0.506258 | 0.326221 | -0.39033 | ... | -0.261712 | -0.089698 | 0.089698 | -0.089698 | -0.089698 | 1.361464 | -0.207992 | 1.305630 | -0.693043 | -1.422563 |
| 1 | -0.084817 | -0.005269 | -0.062185 | -0.285363 | -0.139825 | -0.348085 | -0.801818 | 0.506258 | 0.326221 | -0.39033 | ... | -0.261712 | -0.089698 | 0.089698 | -0.089698 | -0.089698 | 0.107715 | -0.207992 | 0.028586 | 1.442912 | -1.441324 |
2 rows × 67 columns
| 0 | |
|---|---|
| 0 | 285000.0 |
| 1 | 239950.0 |
path_model_xgb = '../models/model_xgb_logtarget.dump'
model = xgboost.XGBRegressor()
model.load_model(path_model_xgb)

ypreds_log1p = model.predict(df_Xtest)
ypreds = np.expm1(ypreds_log1p)

print('ytest:', ytest[:3])
print('ypreds: ', ypreds[:3])
print_regr_eval(ytest,ypreds,df_Xtest.shape[1])
ytest: [285000. 239950. 460000.]
ypreds:  [343218.4  204292.33 508420.8 ]

             RMSE : 110,471.76
Explained Variance: 0.910365
         R-Squared: 0.909445
Adjusted R-squared: 0.908041
import witwidget
from witwidget.notebook.visualization import WitConfigBuilder
from witwidget.notebook.visualization import WitWidget
def custom_predict_fn(z):
    # note: we need to use np.expm1 if we had done log1p transform if target
    testing_data = pd.DataFrame(df_Xtest, columns=df_Xtest.columns.tolist())
    return np.expm1(model.predict(testing_data))
N = 100
HEIGHT = 1000

arr_examples = np.c_[df_Xtest.to_numpy(), ytest][:N]
lst_examples = arr_examples.tolist()

config_builder = WitConfigBuilder(lst_examples, features + [target])

config_builder.set_target_feature(target)
config_builder.set_custom_predict_fn(custom_predict_fn)
config_builder.set_model_type('regression')

WitWidget(config_builder, height=HEIGHT)
!ls images/wh*
images/what_if_tool_snap.png
