Model Evaluation using dalex

import time
time_start_notebook = time.time()
%%capture
import os
import sys
ENV_COLAB = 'google.colab' in sys.modules

if ENV_COLAB:
    ## install modules
    !pip install watermark
    !pip install --upgrade dalex

    # if we update existing module, we need to restart colab
    !pip install -U scikit-learn

    ## print
    print('Environment: Google Colaboratory.')
TREE_METHOD = 'gpu_hist' if ENV_COLAB else 'auto'
import numpy as np
import pandas as pd
import xgboost
import sklearn
from sklearn import metrics as skmetrics
import os
import joblib

# model eval
import dalex
import dalex as dx

# random state
SEED = 0
RNG = np.random.RandomState(SEED)

# versions
import watermark
%load_ext watermark
%watermark -a "Bhishan Poudel" -d -v -m
print()
%watermark -iv
Bhishan Poudel 2020-11-25

CPython 3.7.9
IPython 7.18.1

compiler   : Clang 10.0.0
system     : Darwin
release    : 19.6.0
machine    : x86_64
processor  : i386
CPU cores  : 4
interpreter: 64bit

dalex     0.4.0
pandas    1.1.2
numpy     1.18.5
joblib    0.16.0
json      2.0.9
sklearn   0.23.2
xgboost   1.2.0
watermark 2.0.2
def adjustedR2(rsquared,nrows,ncols):
    return rsquared- (ncols-1)/(nrows-ncols) * (1-rsquared)

def print_regr_eval(ytest,ypreds,ncols):
    rmse = np.sqrt(skmetrics.mean_squared_error(ytest,ypreds))
    r2 = skmetrics.r2_score(ytest,ypreds)
    ar2 = adjustedR2(r2,len(ytest),ncols)
    evs = skmetrics.explained_variance_score(ytest, ypreds)

    print(f"""
             RMSE : {rmse:,.2f}
Explained Variance: {evs:.6f}
         R-Squared: {r2:,.6f}
Adjusted R-squared: {ar2:,.6f}

""")

def show_methods(obj, ncols=4):
    lst = [i for i in dir(obj) if i[0]!='_' ]
    df = pd.DataFrame(np.array_split(lst,ncols)).T.fillna('')
    return df
if ENV_COLAB:
    path_git = 'https://raw.githubusercontent.com/bhishanpdl/Datasets/master/'
    project = 'Projects/King_County_Seattle_House_Price_Kaggle/'
    data_path_parent = path_git + project
else:
    data_path_parent = '../data/'

data_path_Xtest = data_path_parent + 'processed/Xtest.csv.zip'
data_path_ytest = data_path_parent + 'processed/ytest.csv'
target = 'price'
train_size = 0.8

print(data_path_Xtest)
../data/processed/Xtest.csv.zip
# Here, we only need test data
df_Xtest  = pd.read_csv(data_path_Xtest,compression='zip')
ser_ytest = pd.read_csv(data_path_ytest,header=None)
ytest  = np.array(ser_ytest).flatten()
features = list(df_Xtest.columns)

s = f"""
df_Xtest  = {df_Xtest.shape}
ytest     = {ytest.shape}

"""
print(s)

display(df_Xtest.head(2))
display(ser_ytest.head(2))

assert df_Xtest.shape[0] == ytest.shape[0]
df_Xtest  = (4323, 67)
ytest     = (4323,)
| age | age_after_renovation | age_after_renovation_cat | age_after_renovation_sq | age_cat | age_sq | basement_bool | bathrooms | bathrooms_sq | bedrooms | ... | view_sq | waterfront | waterfront_0 | waterfront_1 | waterfront_sq | yr_built | yr_renovated | yr_renovated2 | yr_sales | zipcode | |
|---|---|---|---|---|---|---|---|---|---|---|---|---|---|---|---|---|---|---|---|---|---|
| 0 | -1.372335 | -1.316486 | -1.265291 | -0.845091 | -1.320662 | -0.885667 | -0.801818 | 0.506258 | 0.326221 | -0.39033 | ... | -0.261712 | -0.089698 | 0.089698 | -0.089698 | -0.089698 | 1.361464 | -0.207992 | 1.305630 | -0.693043 | -1.422563 |
| 1 | -0.084817 | -0.005269 | -0.062185 | -0.285363 | -0.139825 | -0.348085 | -0.801818 | 0.506258 | 0.326221 | -0.39033 | ... | -0.261712 | -0.089698 | 0.089698 | -0.089698 | -0.089698 | 0.107715 | -0.207992 | 0.028586 | 1.442912 | -1.441324 |
2 rows × 67 columns
| 0 | |
|---|---|
| 0 | 285000.0 |
| 1 | 239950.0 |
path_model_xgb = '../models/model_xgb_logtarget.dump'
model = xgboost.XGBRegressor()
model.load_model(path_model_xgb)

ypreds_log1p = model.predict(df_Xtest)
ypreds = np.expm1(ypreds_log1p)

print('ytest:', ytest[:3])
print('ypreds: ', ypreds[:3])
print_regr_eval(ytest,ypreds,df_Xtest.shape[1])
ytest: [285000. 239950. 460000.]
ypreds:  [343218.4  204292.33 508420.8 ]

             RMSE : 110,471.76
Explained Variance: 0.910365
         R-Squared: 0.909445
Adjusted R-squared: 0.908041

import dalex
show_methods(dalex)
| 0 | 1 | 2 | 3 | |
|---|---|---|---|---|
| 0 | Arena | dataset_level | fairness | wrappers |
| 1 | Explainer | datasets | instance_level |
def predict_function(model, data):
    return np.expm1(model.predict(data))
exp = dx.Explainer(model, df_Xtest, ytest,
                  predict_function=predict_function,
                  label='xgboost')
Preparation of a new explainer is initiated

  -> data              : 4323 rows 67 cols
  -> target variable   : 4323 values
  -> model_class       : xgboost.sklearn.XGBRegressor (default)
  -> label             : xgboost
  -> predict function  : <function predict_function at 0x7f8de6e95320> will be used
  -> predict function  : accepts only pandas.DataFrame, numpy.ndarray causes problems
  -> predicted values  : min = 1.28e+05, mean = 5.31e+05, max = 5.49e+06
  -> model type        : regression will be used (default)
  -> residual function : difference between y and yhat (default)
  -> residuals         : min = -1.01e+06, mean = 1.11e+04, max = 2.31e+06
  -> model_info        : package xgboost

A new explainer has been created!
show_methods(exp)
| 0 | 1 | 2 | 3 | |
|---|---|---|---|---|
| 0 | data | model_class | model_surrogate | residual |
| 1 | dump | model_diagnostics | model_type | residual_function |
| 2 | dumps | model_fairness | predict | residuals |
| 3 | label | model_info | predict_function | weights |
| 4 | load | model_parts | predict_parts | y |
| 5 | loads | model_performance | predict_profile | y_hat |
| 6 | model | model_profile | predict_surrogate |
# %%time

# mperf = exp.model_performance('regression')
# display(mpperf.result)
# mperf.plot() # if we have 2 models, we can use mperf.plot(mperf2)
| mse | rmse | r2 | mae | mad | |
|---|---|---|---|---|---|
| xgboost | 1.220401e+10 | 110471.757834 | 0.909445 | 62077.413965 | 36802.65625 |
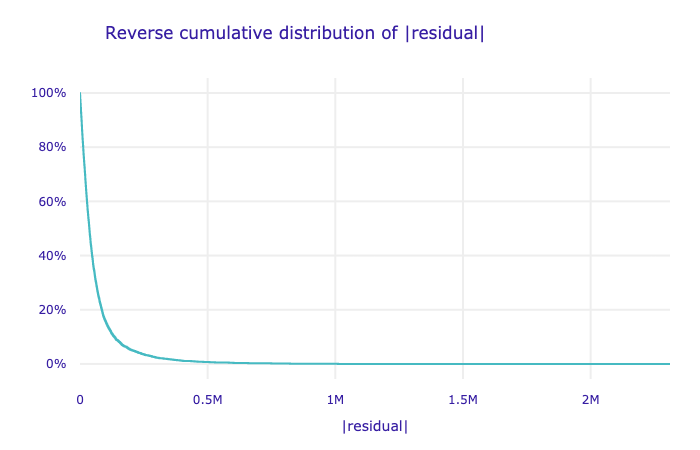
Customize the computation with parameters:
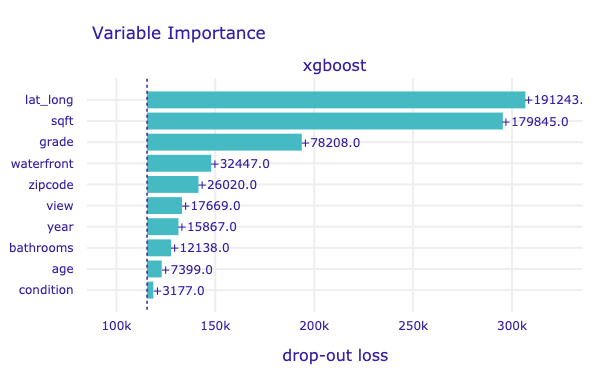
loss_function function to use for drop-out loss evaluation
B number of bootstrap rounds (e.g. 15 for slower computation but more stable results)
N number of observations to use (e.g. 500 for faster computation but less stable results)
variable_groups Dict of lists of variables. Each list is treated as one group. This is for testing joint variable importance
# df_Xtest.columns.to_numpy()
variable_groups = {
    'age': ['age', 'age_after_renovation',
            'age_after_renovation_cat',
            'age_after_renovation_sq', 'age_cat', 'age_sq'],

    'bathrooms': ['bathrooms', 'bathrooms_sq'],

    'bedrooms': ['bedrooms', 'bedrooms_sq'],

    'condition': ['condition', 'condition_1',
                  'condition_2', 'condition_3',
                  'condition_4', 'condition_5'],

    'floor': ['floors', 'floors_sq'],

    'grade': ['grade','grade_10', 'grade_11',
              'grade_12', 'grade_13', 'grade_4',
              'grade_5', 'grade_6', 'grade_7',
              'grade_8', 'grade_9'],

    'lat_long': ['lat','long'],

    'sqft' : ['sqft_above', 'sqft_basement', 'sqft_living',
        'sqft_living15', 'sqft_lot', 'sqft_lot15',
        'log1p_sqft_above', 'log1p_sqft_above_sq',
        'log1p_sqft_basement','log1p_sqft_basement_sq',
        'log1p_sqft_living','log1p_sqft_living15',
        'log1p_sqft_living15_sq','log1p_sqft_living_sq',
        'log1p_sqft_lot', 'log1p_sqft_lot15',
        'log1p_sqft_lot15_sq', 'log1p_sqft_lot_sq'],

    'bool': ['renovation_bool'],

    'view': ['view', 'view_0','view_1', 'view_2', 'view_3',
             'view_4', 'view_sq'],

    'waterfront': ['waterfront','waterfront_0',
                   'waterfront_1', 'waterfront_sq'],

    'year': ['yr_built','yr_renovated',
             'yr_renovated2', 'yr_sales'],

    'zipcode': ['zipcode']

}
model_parts(
    loss_function=None,
    type=('variable_importance', 'ratio', 'difference', 'shap_wrapper'),
    N=1000,
    B=10, # num perm rounds, default = 10
    variables=None, # select only those variables
    variable_groups=None,
    keep_raw_permutations=True,
    processes=1,
    random_state=None,
    **kwargs)
Customize the plot with parameters:
plot(objects=None,
     max_vars=10,
     digits=3,
     rounding_function=<function around at 0x7fe0ced94560>,
     bar_width=16,
     split=('model', 'variable'),
     title='Variable Importance',
     vertical_spacing=None,
     show=True)
vertical_spacing value between 0.0 and 1.0 (e.g. 0.15 for more space between the plots)
rounding_function rounds the contributions (e.g. np.round, np.rint, np.ceil)
digits (e.g. 2 for np.round, None for np.rint)
# mparts = exp.model_parts(variable_groups=variable_groups,B=15)
# mparts.plot(max_vars=10,rounding_function=np.rint,
#         digits=None,vertical_spacing=0.15)
model_profile(type=('partial', 'accumulated', 'conditional'),
              N=300, # num of obs to use **most imp param **
              variables=None,
              variable_type='numerical',
              groups=None,
              span=0.25,
              grid_points=101,
              variable_splits=None,
              variable_splits_type='uniform',
              center=True,
              processes=1,
              random_state=None,
              verbose=True)
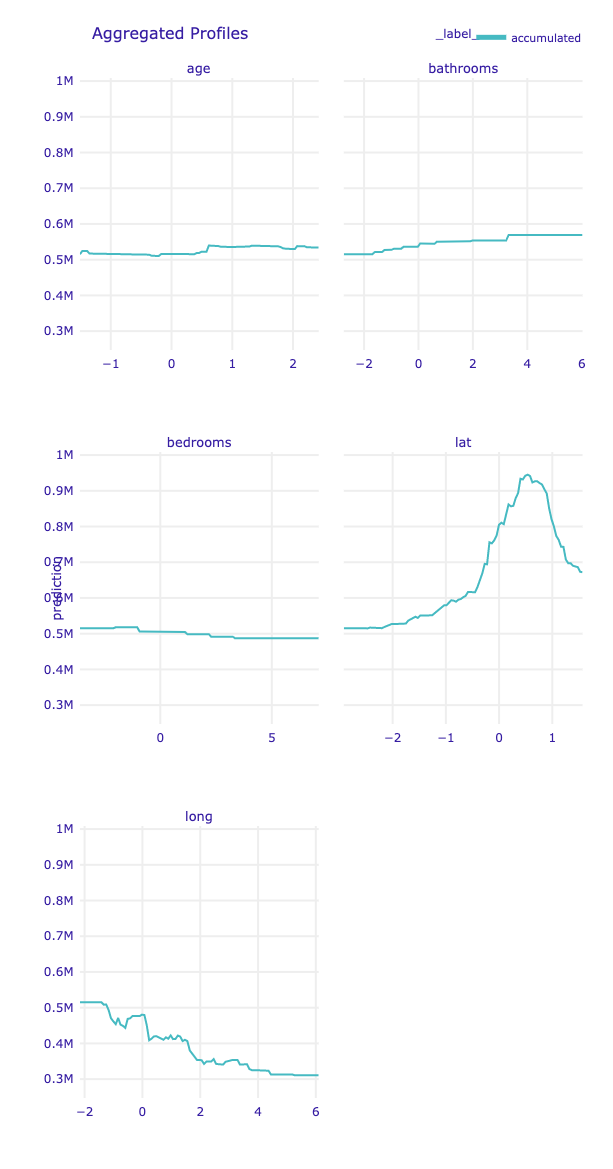
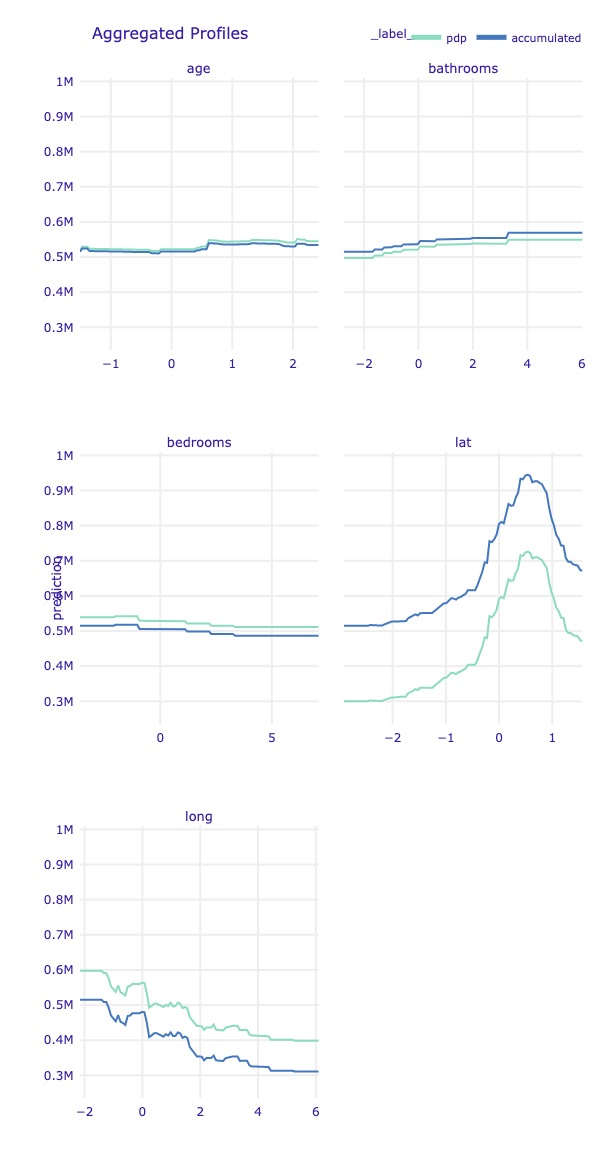
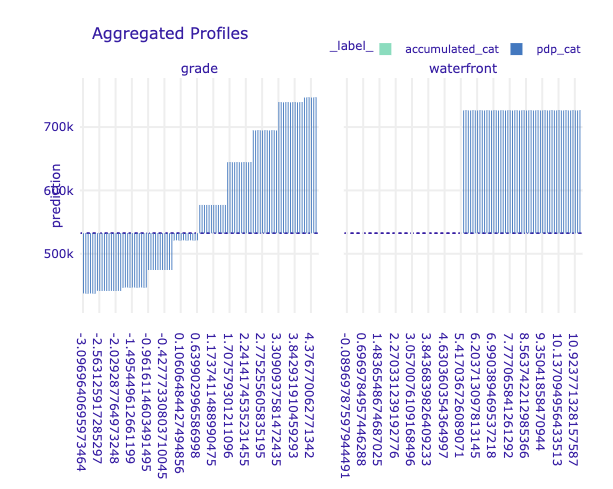
Choose a proper algorithm. The explanations can be calulated as Partial Dependence Profile or Accumulated Local Dependence Profile.
The key parameter is N number of observations to use (e.g. 800 for slower computation but more stable results).
# help(exp.model_profile)
# %%time

# path_mprof_accm = '../models/dalex_mprof_accm.joblib'

# if not os.path.exists(path_mprof_accm):
#     mprof_accm = exp.model_profile(type='accumulated',N=800)
#     mprof_accm.result['_label_'] = 'accumulated'
#     joblib.dump(mprof_accm, path_mprof_accm)
Calculating ceteris paribus: 100%|██████████| 67/67 [01:12<00:00,  1.08s/it]
/Users/poudel/opt/miniconda3/envs/ray/lib/python3.7/site-packages/tqdm/std.py:670: FutureWarning:

The Panel class is removed from pandas. Accessing it from the top-level namespace will also be removed in the next version

Calculating accumulated dependency: 100%|██████████| 67/67 [00:15<00:00,  4.36it/s]
CPU times: user 4min 31s, sys: 31 s, total: 5min 2s
Wall time: 2min 45s
# variables = ['age',
#              'bathrooms', 'bedrooms',
# #     'condition',  'floors', 'grade',
#     'lat','long',
# #     'sqft_above', 'sqft_basement', 'sqft_living',
# #     'view',  'waterfront', 'zipcode'
#             ]

# mprof_accm = joblib.load(path_mprof_accm)
# mprof_accm.plot(variables=variables) # use first parameter another model, if you have it.
# %%time
# path_mprof_pdp = '../models/dalex_mprof_pdp.joblib'

# if not os.path.exists(path_mprof_pdp):
#     mprof_pdp = exp.model_profile(type='partial',N=800)
#     mprof_pdp.result['_label_'] = 'pdp'
#     joblib.dump(mprof_pdp, path_mprof_pdp)
Calculating ceteris paribus: 100%|██████████| 67/67 [01:12<00:00, 1.08s/it]
CPU times: user 4min 28s, sys: 22.1 s, total: 4min 50s
Wall time: 2min 18s
# mprof_pdp = joblib.load(path_mprof_pdp)
# mprof_pdp.plot(mprof_accm, variables=variables)
df_Xtest.head(2)
| age | age_after_renovation | age_after_renovation_cat | age_after_renovation_sq | age_cat | age_sq | basement_bool | bathrooms | bathrooms_sq | bedrooms | ... | view_sq | waterfront | waterfront_0 | waterfront_1 | waterfront_sq | yr_built | yr_renovated | yr_renovated2 | yr_sales | zipcode | |
|---|---|---|---|---|---|---|---|---|---|---|---|---|---|---|---|---|---|---|---|---|---|
| 0 | -1.372335 | -1.316486 | -1.265291 | -0.845091 | -1.320662 | -0.885667 | -0.801818 | 0.506258 | 0.326221 | -0.39033 | ... | -0.261712 | -0.089698 | 0.089698 | -0.089698 | -0.089698 | 1.361464 | -0.207992 | 1.305630 | -0.693043 | -1.422563 |
| 1 | -0.084817 | -0.005269 | -0.062185 | -0.285363 | -0.139825 | -0.348085 | -0.801818 | 0.506258 | 0.326221 | -0.39033 | ... | -0.261712 | -0.089698 | 0.089698 | -0.089698 | -0.089698 | 0.107715 | -0.207992 | 0.028586 | 1.442912 | -1.441324 |
2 rows × 67 columns
variables = ["grade","waterfront"]
df_Xtest[variables].apply(pd.Series.nunique)
grade         10
waterfront     2
dtype: int64
# %%time

# path_mprof_accm_cat = '../models/dalex_mprof_accm_cat.joblib'
# path_mprof_pdp_cat = '../models/dalex_mprof_pdp_cat.joblib'

# if not os.path.exists(path_mprof_accm_cat):
#     mprof_accm_cat = exp.model_profile(type = 'accumulated',
#                                        variable_type='categorical',
#                                        variables=variables)
#     mprof_accm_cat.result.loc[:, '_label_'] = 'accumulated_cat'
#     joblib.dump(mprof_accm_cat, path_mprof_accm_cat)

# if not os.path.exists(path_mprof_pdp_cat):
#     mprof_pdp_cat = exp.model_profile(type = 'partial',
#                                       variable_type='categorical',
#                                       variables=variables)
#     mprof_pdp_cat.result.loc[:, '_label_'] = 'pdp_cat'
#     joblib.dump(mprof_pdp_cat, path_mprof_pdp_cat)
Calculating ceteris paribus: 100%|██████████| 2/2 [00:01<00:00,  1.45it/s]
/Users/poudel/opt/miniconda3/envs/ray/lib/python3.7/site-packages/tqdm/std.py:670: FutureWarning:

The Panel class is removed from pandas. Accessing it from the top-level namespace will also be removed in the next version

Calculating accumulated dependency: 100%|██████████| 2/2 [00:00<00:00,  8.71it/s]
Calculating ceteris paribus: 100%|██████████| 2/2 [00:00<00:00,  2.16it/s]
CPU times: user 8.21 s, sys: 563 ms, total: 8.77 s
Wall time: 5.51 s
# mprof_accm_cat = joblib.load(path_mprof_accm_cat)
# mprof_pdp_cat = joblib.load(path_mprof_pdp_cat)
# mprof_accm_cat.plot(mprof_pdp_cat)
# john = df_Xtest.iloc[[0]] # we need df not series, so use [[index]]
# john.index.name = 'John'
# mary = df_Xtest.iloc[[1]]
# mary.index.name = 'Mary'
# print(type(john))
<class 'pandas.core.frame.DataFrame'>
# exp.predict(john)
array([343218.4], dtype=float32)
predict_parts(new_observation,
    type=('break_down_interactions', 'break_down', 'shap', 'shap_wrapper'),
    order=None,
    interaction_preference=1,
    path='average',
    B=25,
    keep_distributions=False,
    processes=1,
    random_state=None,
    **kwargs)
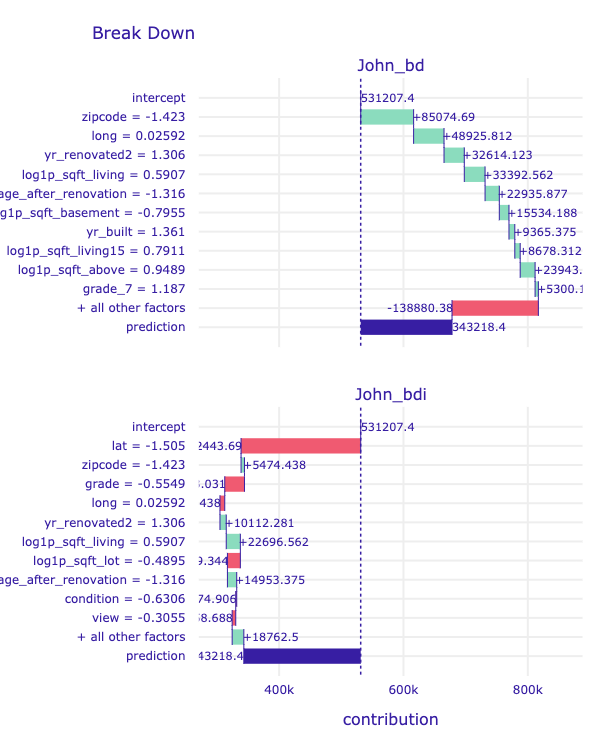
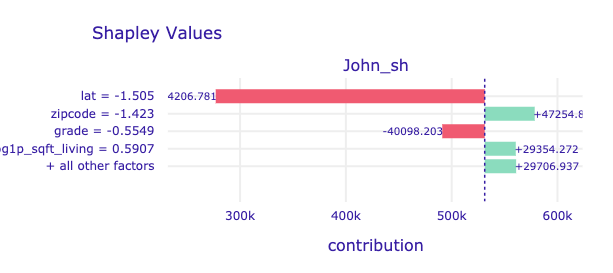
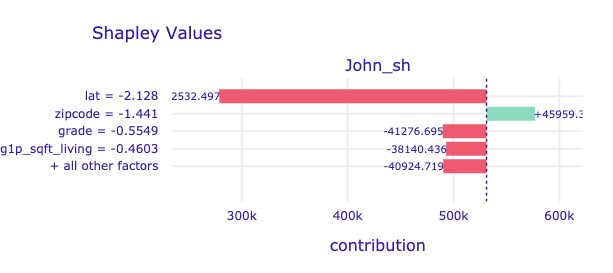
Here we can choose our varible attribution types. The explanations can be calulated as Break Down, iBreakDown or Shapley Values.
For type='shap' the key parameter is B number of bootstrap rounds (e.g. 10 for faster computation but less stable results).
Let's find out what attributes to the house price.
# help(exp.predict_parts)
df_Xtest.head(2)
| age | age_after_renovation | age_after_renovation_cat | age_after_renovation_sq | age_cat | age_sq | basement_bool | bathrooms | bathrooms_sq | bedrooms | ... | view_sq | waterfront | waterfront_0 | waterfront_1 | waterfront_sq | yr_built | yr_renovated | yr_renovated2 | yr_sales | zipcode | |
|---|---|---|---|---|---|---|---|---|---|---|---|---|---|---|---|---|---|---|---|---|---|
| 0 | -1.372335 | -1.316486 | -1.265291 | -0.845091 | -1.320662 | -0.885667 | -0.801818 | 0.506258 | 0.326221 | -0.39033 | ... | -0.261712 | -0.089698 | 0.089698 | -0.089698 | -0.089698 | 1.361464 | -0.207992 | 1.305630 | -0.693043 | -1.422563 |
| 1 | -0.084817 | -0.005269 | -0.062185 | -0.285363 | -0.139825 | -0.348085 | -0.801818 | 0.506258 | 0.326221 | -0.39033 | ... | -0.261712 | -0.089698 | 0.089698 | -0.089698 | -0.089698 | 0.107715 | -0.207992 | 0.028586 | 1.442912 | -1.441324 |
2 rows × 67 columns
# %%time
# john_bd  = exp.predict_parts(john, type='break_down')
# john_bdi = exp.predict_parts(john, type='break_down_interactions')
# john_sh  = exp.predict_parts(john, type='shap', B = 10)

# mary_bd  = exp.predict_parts(mary, type='break_down')
# mary_bdi = exp.predict_parts(mary, type='break_down_interactions')
# mary_sh  = exp.predict_parts(mary, type='shap', B = 10)
CPU times: user 23min 5s, sys: 6.88 s, total: 23min 12s
Wall time: 7min 27s
# john_bd.result.label = "John_bd"
# john_bdi.result.label = "John_bdi"
# john_sh.result.label = "John_sh"

# mary_bd.result.label = "John_bd"
# mary_bdi.result.label = "John_bdi"
# mary_sh.result.label = "John_sh"

# john_bd.result.head()
| variable_name | variable_value | variable | cumulative | contribution | sign | position | label | |
|---|---|---|---|---|---|---|---|---|
| 0 | intercept | 1 | intercept | 531207.3750 | 531207.3750 | 1.0 | 68 | John_bd |
| 1 | zipcode | -1.423 | zipcode = -1.423 | 616282.0625 | 85074.6875 | 1.0 | 67 | John_bd |
| 2 | long | 0.02592 | long = 0.02592 | 665207.8750 | 48925.8125 | 1.0 | 66 | John_bd |
| 3 | yr_renovated2 | 1.306 | yr_renovated2 = 1.306 | 697822.0000 | 32614.1250 | 1.0 | 65 | John_bd |
| 4 | log1p_sqft_living | 0.5907 | log1p_sqft_living = 0.5907 | 731214.5625 | 33392.5625 | 1.0 | 64 | John_bd |
# john_bd.plot(john_bdi)
# john_sh.plot(max_vars=5)
# mary_sh.plot(max_vars=5)
# %%time

# # the variable attribution takes long time, persist the file
# path_va = '../models/dalex_variable_attributes.joblib'

# if not os.path.exists(path_va):
#     # variable attribution
#     va = {'ibd':[], 'sh':[]} # instance breakdown and shapely

#     for idx in df_Xtest.index[0:3]:
#         rowname = df_Xtest.loc[idx,]
#         # if we have index name, then this is useful

#         ibd = exp.predict_parts(rowname, type='break_down_interactions')
#         ibd.result.label = str(rowname)

#         sh = exp.predict_parts(rowname, type='shap', B=1)
#         sh.result.label = str(rowname)

#         va['ibd'].append(ibd)
#         va['sh'].append(sh)

#     # persist the file
#     joblib.dump(va, path_va)
CPU times: user 25min 9s, sys: 5.82 s, total: 25min 15s
Wall time: 7min 26s
# va = joblib.load(path_va)
# va['ibd'][0].plot(va['ibd'][1:3],
#                   rounding_function=np.rint,
#                   digits=None, max_vars=10)
# va['sh'][0].plot(va['sh'][1:3],
#                  rounding_function=np.rint,
#                  digits=None, max_vars=10)
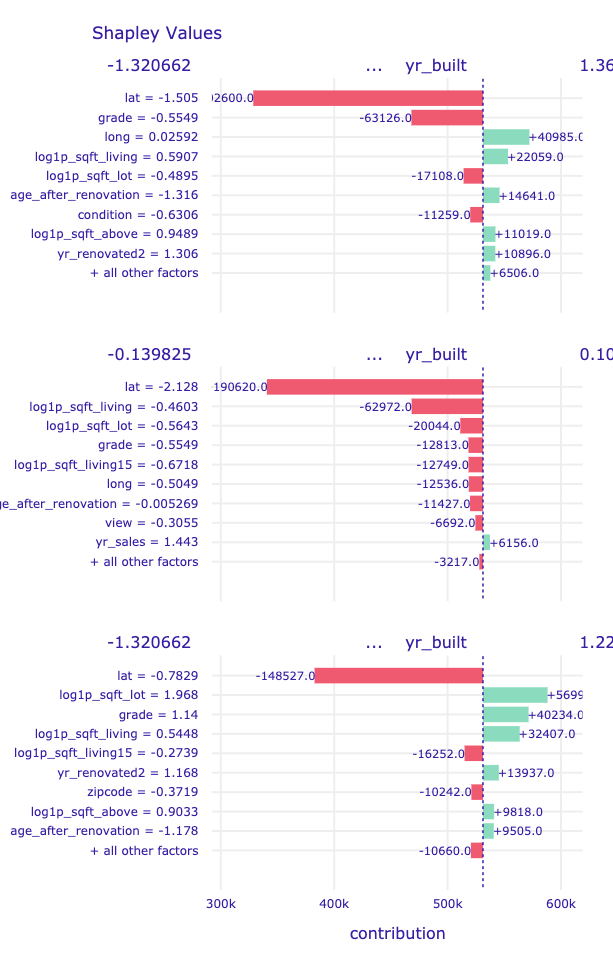
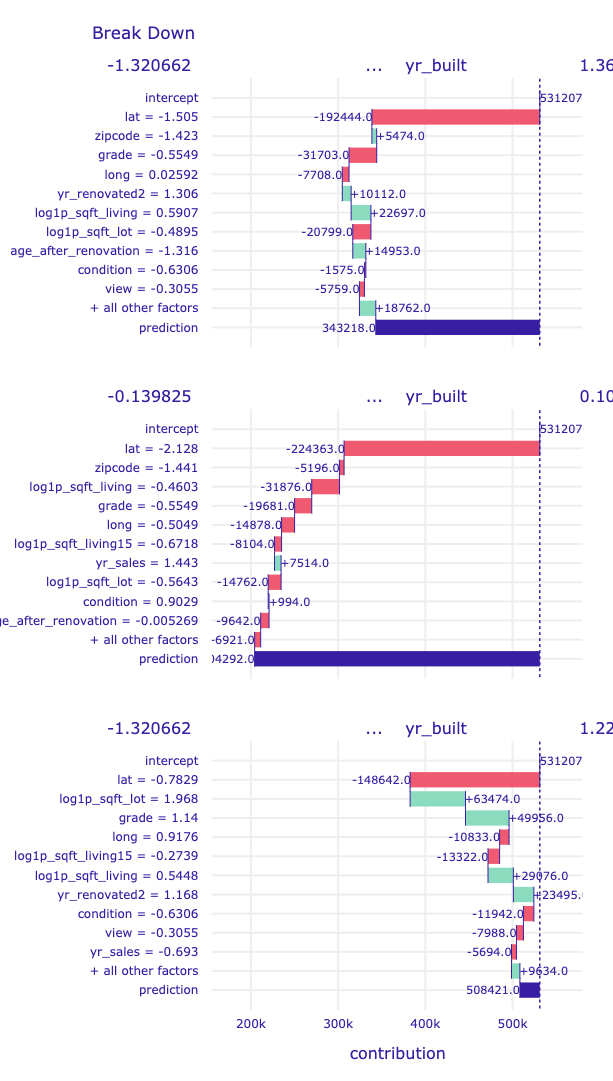
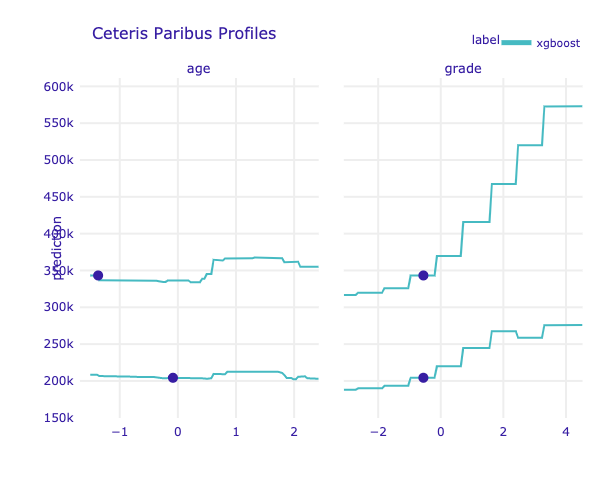
Looking at the Break Down plots, age and movement_ractions variables are standing out. Let's focus on them more.
# %%time

# john_cp = exp.predict_profile(john)
# mary_cp = exp.predict_profile(mary)

# john_cp.result.head()
Calculating ceteris paribus: 100%|██████████| 67/67 [00:00<00:00, 83.48it/s]
Calculating ceteris paribus: 100%|██████████| 67/67 [00:00<00:00, 120.09it/s]
CPU times: user 3.82 s, sys: 95.1 ms, total: 3.92 s
Wall time: 1.64 s
| age | age_after_renovation | age_after_renovation_cat | age_after_renovation_sq | age_cat | age_sq | basement_bool | bathrooms | bathrooms_sq | bedrooms | ... | yr_built | yr_renovated | yr_renovated2 | yr_sales | zipcode | _original_ | _yhat_ | _vname_ | _ids_ | _label_ | |
|---|---|---|---|---|---|---|---|---|---|---|---|---|---|---|---|---|---|---|---|---|---|
| John | |||||||||||||||||||||
| 0 | -1.507863 | -1.316486 | -1.265291 | -0.845091 | -1.320662 | -0.885667 | -0.801818 | 0.506258 | 0.326221 | -0.39033 | ... | 1.361464 | -0.207992 | 1.30563 | -0.693043 | -1.422563 | -1.372335 | 343218.40625 | age | 0 | xgboost |
| 0 | -1.468560 | -1.316486 | -1.265291 | -0.845091 | -1.320662 | -0.885667 | -0.801818 | 0.506258 | 0.326221 | -0.39033 | ... | 1.361464 | -0.207992 | 1.30563 | -0.693043 | -1.422563 | -1.372335 | 343218.40625 | age | 0 | xgboost |
| 0 | -1.429257 | -1.316486 | -1.265291 | -0.845091 | -1.320662 | -0.885667 | -0.801818 | 0.506258 | 0.326221 | -0.39033 | ... | 1.361464 | -0.207992 | 1.30563 | -0.693043 | -1.422563 | -1.372335 | 343218.40625 | age | 0 | xgboost |
| 0 | -1.389954 | -1.316486 | -1.265291 | -0.845091 | -1.320662 | -0.885667 | -0.801818 | 0.506258 | 0.326221 | -0.39033 | ... | 1.361464 | -0.207992 | 1.30563 | -0.693043 | -1.422563 | -1.372335 | 343218.40625 | age | 0 | xgboost |
| 0 | -1.372335 | -1.316486 | -1.265291 | -0.845091 | -1.320662 | -0.885667 | -0.801818 | 0.506258 | 0.326221 | -0.39033 | ... | 1.361464 | -0.207992 | 1.30563 | -0.693043 | -1.422563 | -1.372335 | 343218.40625 | age | 0 | xgboost |
5 rows × 72 columns
# john_cp.plot(mary_cp, variable_type='categorical')

# john_cp.plot(mary_cp, variables=['age','grade'])
# %%time
# variables = ['lat','grade']
# cp = exp.predict_profile(df_Xtest.iloc[2:3,],variables=variables)
Calculating ceteris paribus: 100%|██████████| 2/2 [00:00<00:00, 87.40it/s]
CPU times: user 59.3 ms, sys: 5.1 ms, total: 64.4 ms
Wall time: 40.8 ms
# cp.plot(size=3, title="Explanation for 3rd row")]
%%bash
rm -rf ../models/dalex*
time_taken = time.time() - time_start_notebook
h,m = divmod(time_taken,60*60)
print('Time taken to run whole notebook: {:.0f} hr '\
      '{:.0f} min {:.0f} secs'.format(h, *divmod(m,60)))
Time taken to run whole notebook: 0 hr 23 min 52 secs